Jun Horigome*1
Fluorescence fingerprinting for food distinction is a technique for multivariate analysis of numerical data entailing acquisition of a fluorescence pattern unique to a specimen (fluorescence fingerprint) and analysis of fluorescence intensity in the massive amount of data acquired. Anticipated applications include identification of samples and determination of their geographical origin1), calculation of blended sample proportions2), detection of mycotoxins and other hazardous substances3-6), and quantification of functional components. In fluorescence fingerprinting, the 3D fluorescence spectrum measurement mode of a fluorescence spectrophotometer is used to plot contour maps or overhead views of three phenomena: excitation wavelength, fluorescence wavelength, and fluorescence intensity. Because fluorescence is observed more toward the long wavelength side of the spectrum than the excitation wavelength, and because fluorescence wavelength for the same component does not change even if the excitation wavelength is changed, the distribution of fluorescence intensity depicted on contour maps acquires the appearance of a fingerprint. In the past, identification or quantification of components utilized single peak wavelengths comprising the excitation wavelength and fluorescence wavelength of the component of interest, but comprehensive analysis of multi-component fluorescence data inherent in a sample can provide greater accuracy in analysis.
The Fluorescence Spectrophotometer F-7000 incorporates technology for high-throughput, three-dimensional fluorescence spectrum measurement such as a best-in-class scanning speed (60,000 nm/min), automatic setting of interactive processing for high-speed scanning, and rapid excitation wavelength switching. Simple and rapid elimination of higher-order light appearing as ghost peaks was a challenge in three-dimensional fluorescence spectrum measurement. The automatic filter accessory shown in Fig. 1 eliminates the effect of unwanted higher-order light (e.g., second-order light, third-order light) unique to the spectrometer by automatically inserting a filter suited to the measurement conditions (Fig. 2).
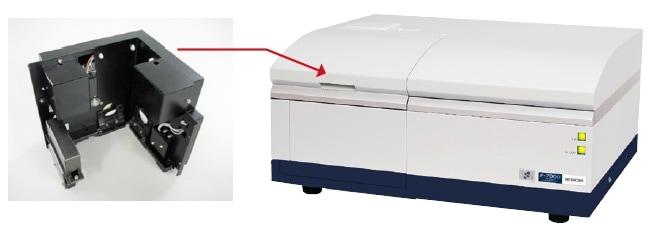
Fig. 1 External appearance of the Fluorescence Spectrophotometer F-7000 and automatic filter accessory
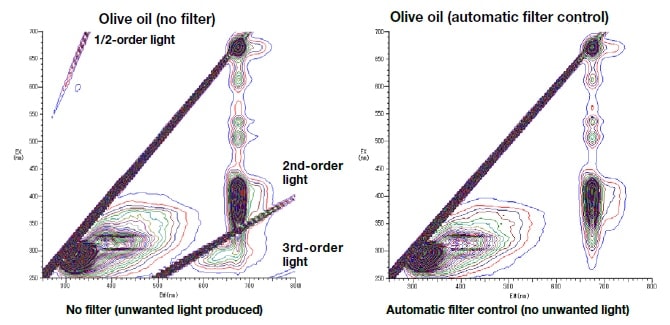
Fig. 2 Example of 3rd-order fluorescence spectrum (olive oil)
Fluorescence fingerprint analysis has three major distinguishing features, as described below.
In general, excitation wavelength and fluorescence wavelength are measured in a wavelength range from ultraviolet to visible (approx. 200-800 nm). The fluorescence intensity obtained can comprise tens of thousands of data points, and this enormous amount of numeric data is used in multivariate analysis for identification analysis.
In general, instrument analysis of food or crop materials involves various pretreatment processes. To the greatest extent possible, fluorescence fingerprint analysis measures a fluorescence pattern unique to a sample itself. Measurement can be accomplished with the minimum necessary level of grinding, dissolving, filtering, or other pretreatment, and samples such as fruit sections or fresh meat are often analyzed directly. The lack of need for complex pretreatment is one great appeal. Samples can also be analyzed in solution or in solid form (e.g., sheet or powdered form).
Setup and operating costs for the equipment are lower than those of ordinary analytical instruments. For example, in the case of mycotoxin analysis reported by Fujita et al. 3-6), the use of fluorescence fingerprinting analysis is likely to reduce the cost of analysis in the expensive preliminary stage of sample selection (screen analysis) for techniques such as mass spectrometry.
Starches including corn, potato, and wheat as ingredients were prepared, and fluorescence fingerprint measurement results were used in efforts to identify starch varieties. Sample quantities of approximately 0.7 cm3 were sealed in powder cells and placed in solid sample holders able to measure fluorescence on the sample surface (Fig. 3). Figure 4 shows the fluorescence fingerprints obtained. Each sample demonstrated several peaks. Peaks observed near a fluorescence wavelength of 300 nm were conjectured to derive from amino acid constituents of proteins. The wavelengths of the peaks produced did not show major differences among the samples, but differences in peak intensity were observed. On this basis, the fluorescence intensity of representative wavelengths corresponding to peaks and valleys was identified for principal component analysis. Figure 5 presents the results, with Principal Component 1 on the y-axis and Principal Component 2 on the x-axis. The plots show gross distinctions corresponding to respective ingredients. For example, the location of plots including a blended item is discernibly different than that for a pure item. These results were interpreted as corn- and potato-based blends. Thus, the use of principal component analysis has potential application in identification of ingredients in unknown samples, quality control, and defective product analysis.

Fig. 3 Sample system
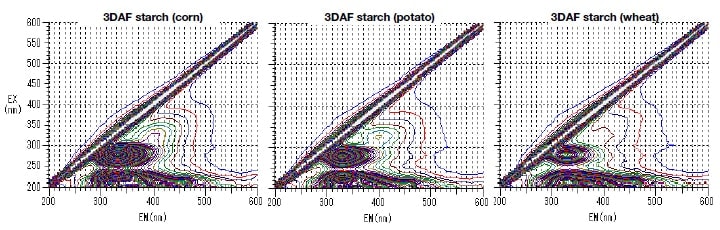
Fig. 4 Fluorescence fingerprint of starch ingredients
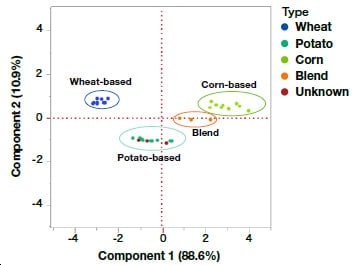
Fig. 5 Principal component analysis results
The fluorescence fingerprints of spring turmeric powder and fall turmeric powder were measured, and the fluorescence wavelength particular to spring turmeric powder was used to estimate the blended ratios of spring and fall turmeric powder. Figure 6(a) shows a fluorescence fingerprint representing 0% spring turmeric and 100% fall turmeric; Fig. 6(b) represents 100% spring turmeric and 0% fall turmeric. Mock samples containing 25%, 50%, and 75% spring turmeric were also prepared. Figures 6(c) through 6(e) show the measurement results for fluorescence fingerprints for each of these samples. Unique fluorescence peaks for spring turmeric powder were detected at an excitation wavelength of 340 nm and a fluorescence wavelength of 440 nm. The sample with 0% spring turmeric was designated STD1, and that with 100% spring turmeric was designated STD2; a calibration curve was constructed using the fluorescence intensity at these wavelengths, and the blended ratios in a blended power of spring turmeric and fall turmeric were calculated based on fluorescence intensity (Fig. 7).
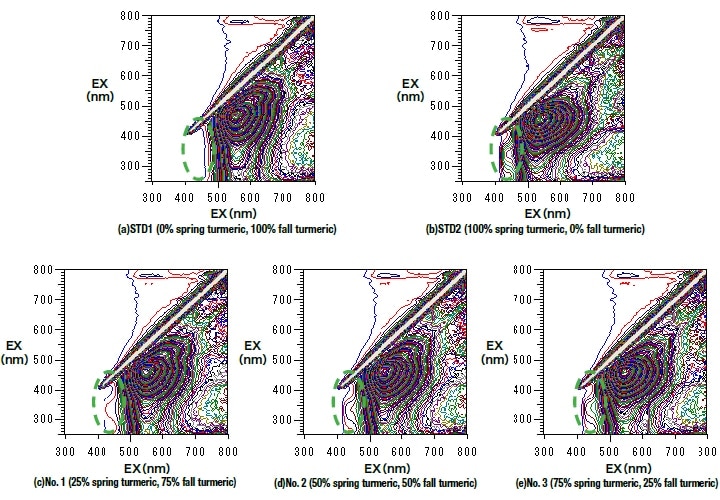
Fig. 6 Three-dimensional fluorescence spectrum for various turmeric blends
Fig. 7 Relationship of fluorescence intensity and blended ratio (%)
Results from measurement were found to coincide with the theoretical blended ratios, within a range of measurement error (Table 1, Table 2). By investigating identifying wavelengths based on sample-specific fluorescence fingerprints and using their fluorescence intensity or fluorescence intensity ratio, the blending ratios of powdered samples were estimated successfully.
| STD1 | STD2 | No.1 | No.2 | No.3 | |
|---|---|---|---|---|---|
| 1 | 5.51 | 72.58 | 22.90 | 39.86 | 54.10 |
| 2 | 4.68 | 72.76 | 20.96 | 39.51 | 55.15 |
| 3 | 4.91 | 71.29 | 22.98 | 38.94 | 53.05 |
| Mean values | 5.04 | 72.21 | 22.28 | 39.44 | 54.10 |
| No.1 | No.2 | No.3 | |
|---|---|---|---|
| 1 | 26.6 | 51.8 | 73.0 |
| 2 | 23.7 | 51.3 | 74.6 |
| 3 | 26.7 | 50.5 | 71.5 |
| Blended ratios, calculated | 22.28 | 39.44 | 54.10 |
| Theoretical blended ratios | 25.0 | 50.0 | 75.0 |
The fluorescence fingerprints of commercial olive oil and virgin olive oil were measured. Figure 8 shows the measurement results. Samples were placed in a PMMA cell without dilution or other pretreatment, and fluorescence from the sample surface was measured. All olive oil samples demonstrated fluorescence peaks in two regions: Excitation wavelengths of 250-450 nm and fluorescence wavelengths of approximately 300-600 nm (Region 1), and excitation wavelengths of 300-700 nm and fluorescence wavelengths of 650-750 nm (Region 2). Region 1 suggested fluorescence corresponding to oxidation products, and Region 2 suggested fluorescence corresponding to chlorophyll7). Fluorescence intensity was picked up from the Region 1 fluorescence peak at a 320 nm excitation wavelength and a 400 nm fluorescence wavelength (i) and from the Region 2 fluorescence peak at a 415 nm excitation wavelength and a 675 nm fluorescence wavelength (ii), and the fluorescence intensity ratio ((ii)/(i)) of these peaks was calculated. Comparison of fluorescence intensity ratios showed that values were higher for virgin olive oil than for commercial olive oil. Virgin olive oil is an oil squeezed from olive fruits and not subjected to refining or other processing, and thus high levels of chlorophyll contained in the olive fruits were detected. Commercial olive oil, however, is subjected to refining or other processing, which apparently reduced its chlorophyll content in the process, leading to detection of low levels. Virgin olive oil also showed low levels of fluorescence corresponding to oxidation products. In reality, because quality standards have been established for the oxidation level, flavor, fragrance, and other attributes of virgin olive oil, this method cannot be used to determine the quality of olive oil; however, it is likely to find application for easy discrimination of items such as counterfeit products.
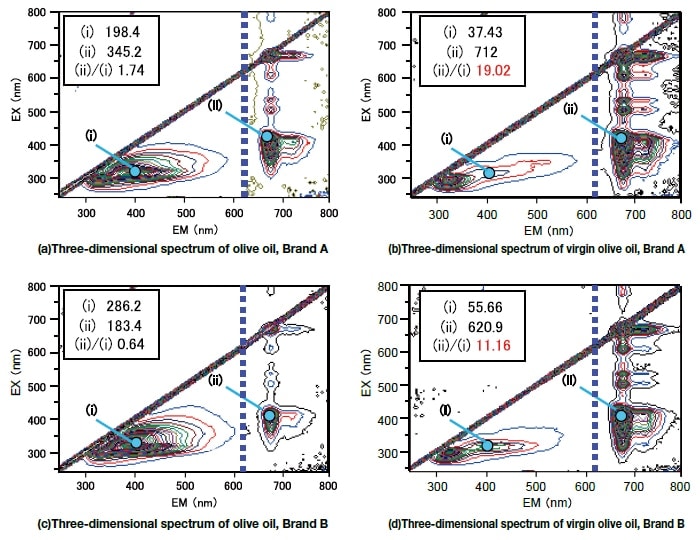
Fig. 8 Three-dimensional fluorescence spectrum of olive oil
In this example using pineapple in fruit product form, the three-dimensional fluorescence spectrum was measured and used for classification of varieties. Figure 9 shows a fluorescence fingerprint of pineapple juice. Results from measurement of the three-dimensional fluorescence spectrum demonstrated a fluorescence fingerprint conjectured to represent amino acids, vitamins, and chlorophyll. Next, a three-dimensional fluorescence spectrum (fluorescence fingerprint) for individual pineapple samples was acquired and used in principal component analysis. The samples were placed in wide cells and mounted in a solid specimen holder. Before mounting, jam, fruit, and other non-uniform samples were sealed to prevent the samples from sticking to the quartz sheet.
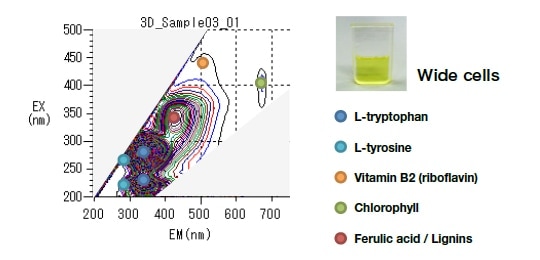
Fig. 9 Predicted fluorescence fingerprint of pineapple juice and unique fluorescent substances
Figure 10 shows an example of discrimination analysis for each sample making use of principal component analysis. In raw pineapple fruit, Principal Component 1 and Principal Component 2 demonstrated positive values, and in canned pineapple fruit, values approached the origin. In jam produced from pineapple alone, values were also near the origin, and in a mixed jam including mango, Principal Component 1 had a positive value, and Principal Component 2 had a negative value. In a storage-type pineapple juice, Principal Component 1 had a value slightly negative relative to the origin, and Principal Component 2 had a slightly positive value. In a reconstituted pineapple juice, Principal Component 1 and Principal Component 2 had negative values. These results demonstrated the characteristic feature that increasingly positive calculated values of Principal Component 1 and Principal Component 2 were associated with progressively less processed states.
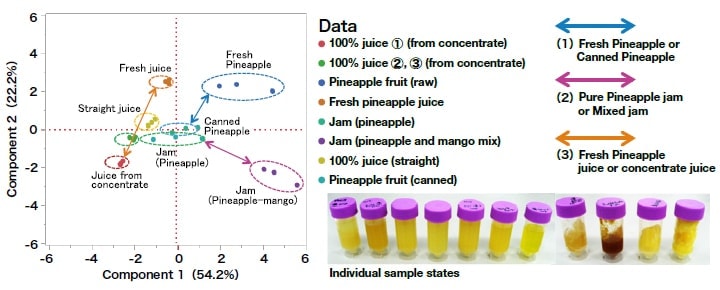
Fig. 10 An example of discrimination by principal component analysis of samples
The field of foods involves many different types of specimens, and the perspectives highlighted by analysis also differ substantially, depending on their purpose. As a result, research has addressed the expansion of applied examples for purposes such as creation of analytical techniques suited to different specimens and purposes5). Efforts to apply fluorescence fingerprint analysis to food fields have resulted in reported results in a wide range of fields, and levels of interest have increased dramatically in recent times. It is hoped that fluorescence fingerprinting analysis settles as a method for more convenient and rapid analysis than conventional methods and that it eventually becomes a technology with potential for societal contribution.
References
Authors
See more
