Fluorescence Spectra of Plate Samples
This is to introduce you example of plasma display fluorescence spectrum measurement with solid sample holder (optional accessory).

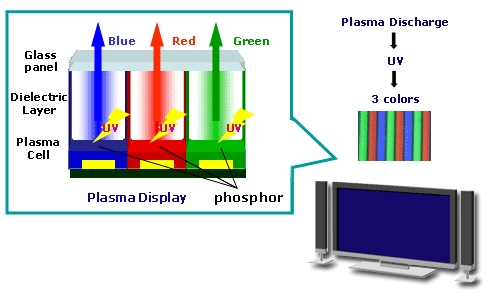
Inside plasma display, UV radiation generated from electric discharge excites phosphor, so that light three primary colors RGB are displayed. Fluorescence spectrum measurement is widely-used due to novel exploitation of high-intensity phosphor and display panel QC.
3D Fluorescence Spectrum of PDP Display
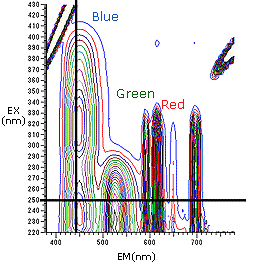
This is to introduce you plasma display 3D measurement result.
BRG spectrum are confirmed in each excitation wavelength.
Due to high-speed wavelength scan by Hitachi Fluorescence Spectrophotometer, you can get the data (shown on right) in mere 1.5 minutes.
3D measurement enable you to get much information at once with one sample and reduce analysis time. And more, ultra high-speed scan is effective to measure sample which change performance with time.
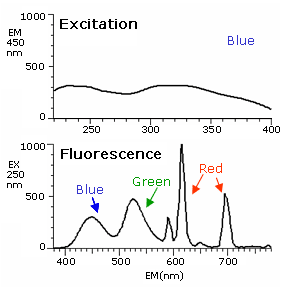
3D measurement data is able to converted to 2D data display.
Right figures show spectrum in specific wavelength as a excitation and fluorescent spectrum of plasma display. BRG spectrum data displayed in 2D is applicable to fluorescence color measurement (fluorescence trichromatic coordinate).