
Imari Sato*1

Yinqiang Zheng*2

Jun Horigome*3

Hiroki Okawa*4
Fluorescent materials have found applications in several product areas that are tightly interwoven into the fabric of modern daily life, from white LEDs and fluorescent clothing whiteners to security inks used to prevent counterfeiting of negotiable instruments. The spectral properties of these fluorescent materials are typically quantified experimentally by using a fluorescence spectrophotometer to measure characteristic spectra. Experimentally relevant spectral data include both excitation spectra—which are obtained by fixing the fluorescence wavelength and scanning the wavelength of the excitation light (the irradiating beam), yielding information on the relationships among fluorescence intensities at the excitation wavelengths—and fluorescence spectra, obtained by scanning the fluorescence wavelength at fixed excitation wavelength to yield information on the relationships among fluorescence intensities at fluorescence wavelengths. The shapes of these spectra reflect the color tones of experimental samples. Relatively recent advances in measurement technology have enabled the innovation of acquiring three-dimensional fluorescence spectra—in which the excitation wavelength, fluorescence wavelength, a nd fluorescence i ntensity a re all measured simultaneously—
and the increased scan speeds made possible by this technique have established it firmly among the ranks of reliable characterization methods. The acquisition of a three-dimensional spectrum lends comprehensive insight into the wavelength characteristics of a fluorescent material.
Three-dimensional fluorescence spectra reflect the fluorescence properties of organic matter contained in samples and give rise to benchmarks that allow the composition and the chemical or physical state of individual constituents to be uniquely identified; for this reason, such spectra are sometimes known as fluorescent fingerprints. As one example of the practical utility of this technique in familiar everyday settings, we note that the fluorescence patterns present in three-dimensional fluorescence spectra of oliveoil samples suffice to distinguish the high-quality products known as extra-virgin oils from their lower-grade pure counterparts.
However, fluorescence spectrophotometer measurements to date have been limited to acquiring information on the spatially-averaged fluorescence spectrum of the region irradiated by the excitation light (a single point). In particular, for samples in which fluorescent components exhibit a non-uniform distribution, conventional instruments have been unable to study the distribution of fluorescence emissions within sample surfaces.
To address this shortcoming, in this study we equip a fluorescence spectrophotometer with a new CMOS camera unit—enabling simultaneous acquisition of sample images during measurements of fluorescence spectra—and attempt to estimate the intra-surface fluorescence distributions of samples via analysis of optical images.
Fig. 1 depicts the experimental setup we consider in this study. An integrating sphere is positioned inside the specimen chamber of a conventional fluorescence spectrophotometer (F-7100), with the sample mounted in a port above the sphere. The excitation light from the fluorescence spectrophotometer is drawn inside the integrating sphere via the excitation light influx port; after allowing the light to diffuse within the interior of the sphere as a uniformization step, it is directed onto the sample. Light emitted by the sample emerges from the fluorescence outflux port—which is positioned at an angle of 90 degrees from the excitation light influx port—and is captured by fluorescent-side spectrophotometer for spectral measurements. The CMOS camera is positioned at a port beneath the integrating sphere, where it can capture images of the sample during irradiation by excitation light.
The white light obtained by taking the excitation wavelength of the fluorescence spectrophotometer as the zerothorder light is directed onto the sample and images of the sample in the presence of this white-light irradiation are acquired. Thereafter, the sample is irradiated at fixed intervals by light at the excitation wavelength and the fluorescentside spectrophotometer is used to measure the fluorescence spectrum of the sample at various excitation wavelengths, yielding three-dimensional fluorescence spectra. Simultaneously, images of the sample at each excitation wavelength are captured by the CMOS camera.
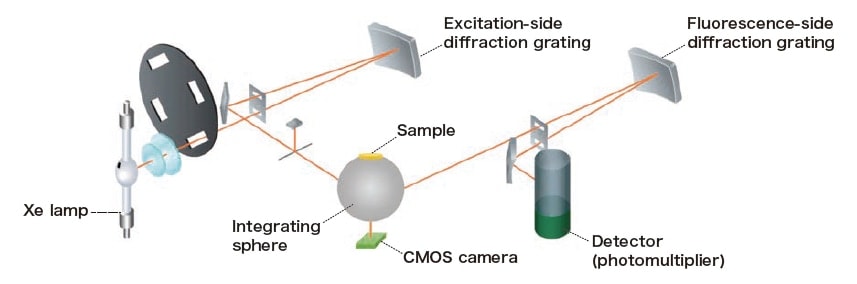
Fig. 1 System architecture diagram
The light observed to result from irradiation of a fluorescent sample (target sample) is composed of two components: fluorescence emitted by the sample and the reflection of the irradiating light. Whereas the wavelength of the reflected component is just the wavelength of the irradiating light, the wavelength of the fluorescent component is longer than that of the irradiation. By actively exploiting the difference between these phenomena, we can separate the sample images into the reflection component and the fluorescent component by image analysis.
Fig. 2 presents the concept of a fluorescence spectrum and an example of the separation technique applied to fluorescent materials. As shown in the upper portion of Fig. 2, the observed light (blue plot) from a fluorescent material consists of reflected light and fluorescent emission. While the reflected light wavelength is the same as the irradiation
wavelength (red plot), the fluorescent spectrum has longer wavelengths. A variety of techniques have been developed to exploit these properties for the purpose of separating reflected and fluorescent components in observed images.
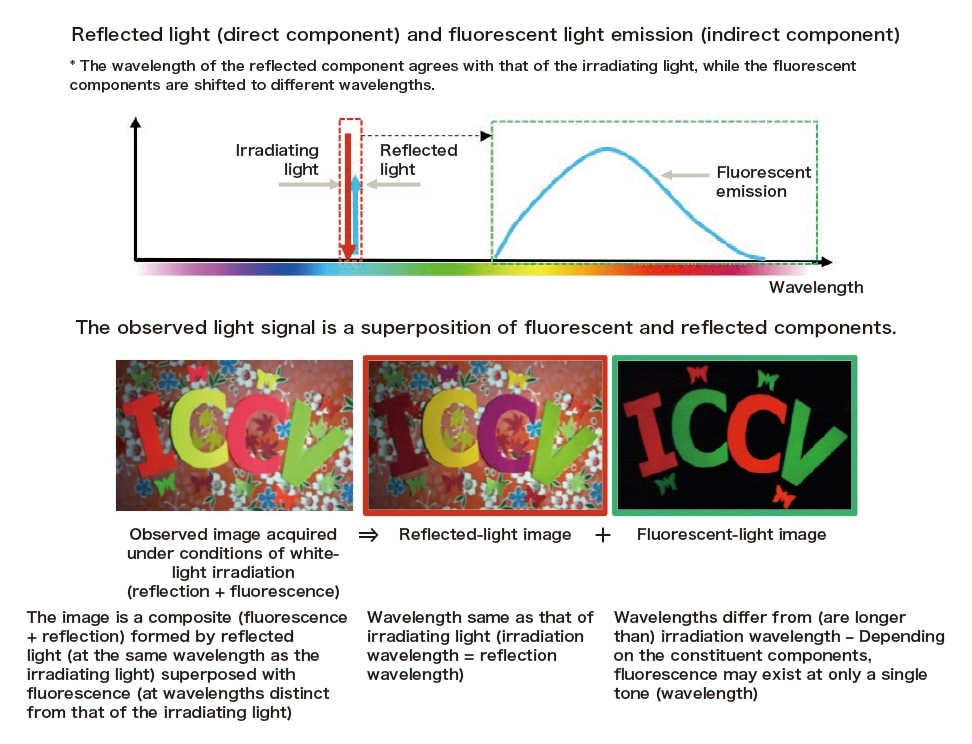
Fig. 2 Illustration of the relationship between fluorescent and reflected components of observed images and spectra. The observed light is a superposition of fluorescent and reflected components.
The lower portion of Fig. 2 depicts one example of the separation technique. The observed sample image for each of the three color channels (R,G,B) include both reflected and fluorescent components. By modeling the fluorescence properties of the target sample, we can separate the spatial and spectral distributions of the reflected and fluorescent components from acquired images.
We next present the model used to effect this separation. The observed light from the target sample can be expressed as the sum of reflected and fluorescent components, i.e.,
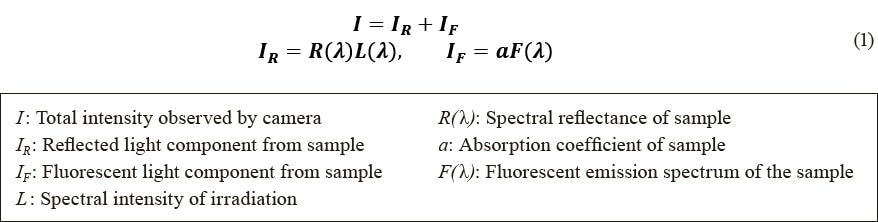
In this equation, I denotes the total light observed from the target sample, while IR and IF denote the reflected and fluorescent components of this light, respectively. Also, L is the spectral intensity of the irradiation, R is the spectral reflectance, and a and F denote the absorbance and fluorescence spectrum of the material, respectively. The reflected light observed from the sample, IR, can be expressed as the product of the spectral intensity of the irradiation, L, and the spectral reflectance R. Meanwhile, the fluorescence observed from the target sample, IF, can be expressed as the product of the absorbance a and the fluorescent emission spectrum F of the material.
Because the camera has three color channels (R,G,B), the value I observed for a given pixel is determined by the values Ir, Ig, Ib observed for each of the three channels. As shown in Fig. 3, the R,G,B channels of the camera have distinct spectral sensitivities Cr, Cg, Cb, and the channel-resolved observation values Ir, Ig, Ib must be corrected to account for these sensitivities. The R,G,B values observed for a given pixel may be expressed as convolution integrals involving the channel-specific spectral sensitivities, i.e.,
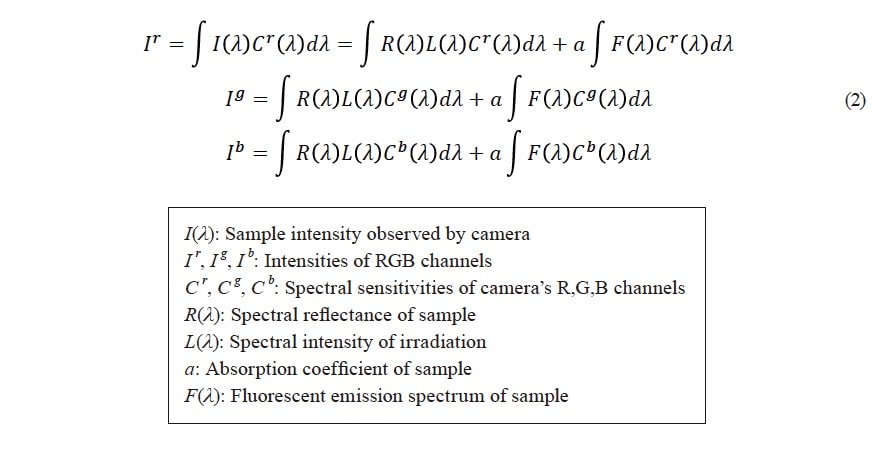
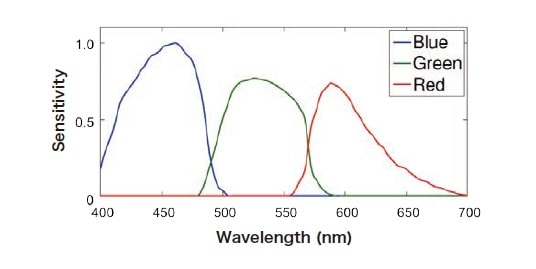
Fig. 3 Spectral sensitivities of camera’s color channels
Solving this model requires advance knowledge of either a known reflection spectrum or a known fluorescence spectrum (that is, the excitation spectrum, which contains absorbance information, and the emission spectrum, which contains fluorescence emission information). However, an RGB image does not contain such detailed spectral information.
A fluorescence spectrophotometer irradiates the body under observation with excitation light at a single wavelength, then measures wavelength-resolved properties of the resulting light emission; repeating this process at various excitation wavelengths yields comprehensive measurements of the fluorescence properties of the body under observation. The excitation wavelength is set successively to each of N excitation wavelengths separated by fixed wavelength intervals; applying the reflection/fluorescence model of Eq. (2) to the kth wavelength (k=1,2,…,N), we have
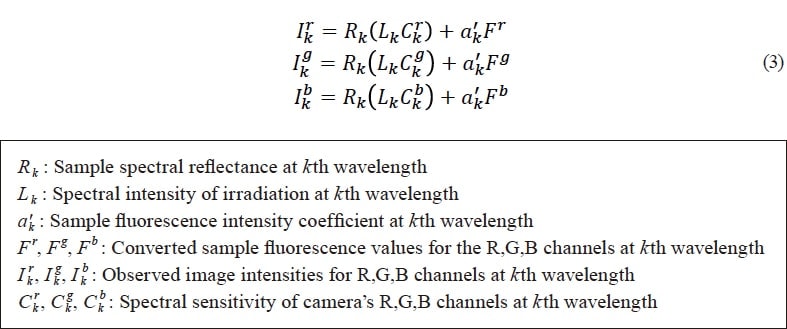
The value of the reflected component at the kth wavelength can be expressed as the product of the reflectance Rk , the spectral intensity of the irradiation Lk, and the spectral sensitivities (Cr,Cg,Cb) of the camera. The value of the fluorescent component at the kth excitation wavelength may be expressed as the product of an intensity-related coefficient a'k and a fluorescent distributions (Fr,Fg,Fb ). From Eq. (1), the value of the fluorescent component can be expressed as the product of the absorbance a and the fluorescence spectrum F for the material, but we have replaced the absorbance a by the intensity-related coefficient a'k to convert the measured value of the fluorescence spectrum F to color-resolved fluorescent distributions (Fr,Fg,Fb ).
Fig. 4 shows a schematic diagram of our estimation model and our computational method. The quantity LkCk in Eq. (3) is measured from images captured using a standard white slab, while the fluorescent distributions (Fr,Fg,Fb ) can be determined from the fluorescence spectrum F measured by the fluorescence spectrophotometer and the known spectral sensitivities (Cr,Cg,Cb) of the camera. Then the only unknown quantities in Eq. (3) are the reflectance at the wavelength k, Rk, and the fluorescent component coefficient a'k , which can be determined by any arbitrary method.
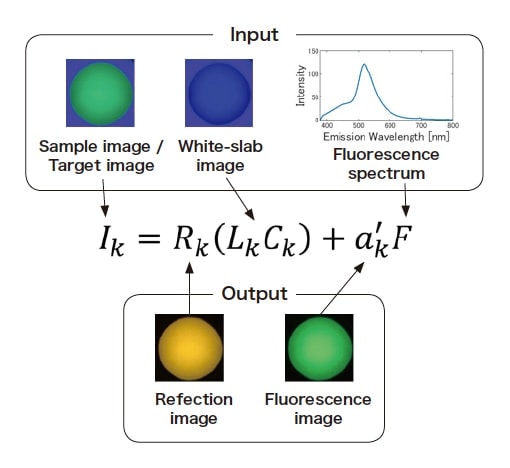
Fig. 4 Schematic diagram of our estimation model and computational method. In this example, the input image was acquired under 400 nm light illumination
By repeating this calculation for all excitation wavelengths and all image pixels, we obtain the spectral properties of reflection and fluorescence and their spatial distributions on the sample surface, respectively (Fig. 5 and 6).
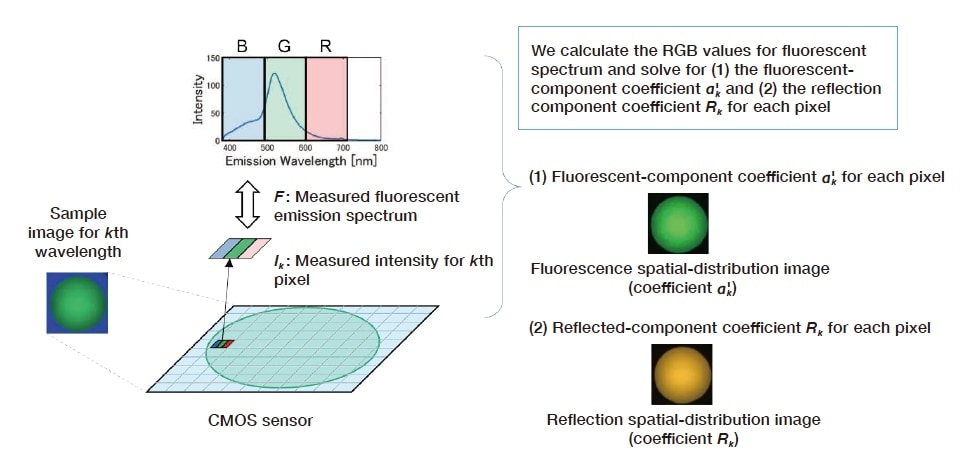
Fig. 5 Imaging method for reflection- and fluorescent-component distributions for target sample
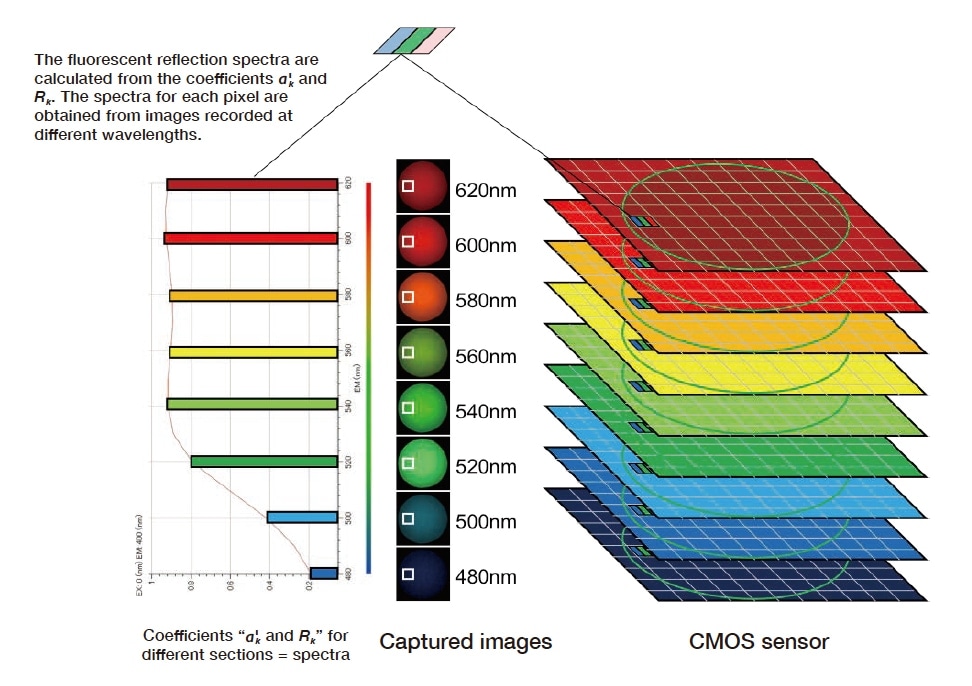
Fig. 6 Spectral conversion of reflected and fluorescent components for the target sample
・Spectral reflectance: reflection spectra
To validate the spectral reflectance computed using our model, we conduct experiments on samples with known spectral reflectance measured in advance using the spectrophotometer. For this experiment, we prepared 4 samples with distinctly distributed spectral reflectance and uniform surfaces. The results, shown in Fig. 7, confirm that the estimation obtained using our model agrees well with known reflection spectra for all samples.
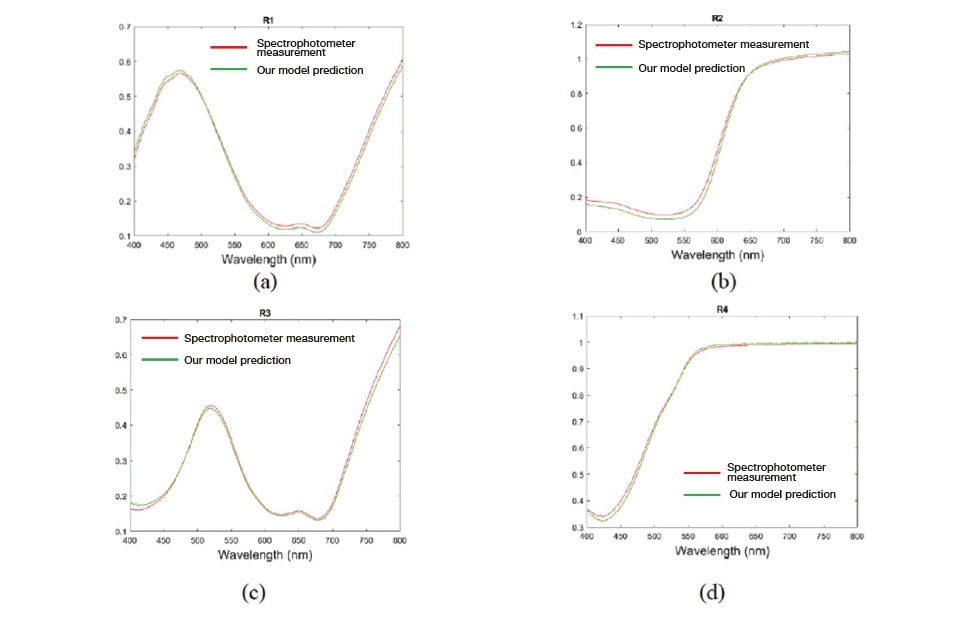
Fig. 7 Experimental validation results for reflection spectra
・Fluorescence properties: fluorescence spectra
Similarly, we conducted an experiment to evaluate the validity of the computed fluorescence spectra. This was performed by comparing with spectra measured using a fluorescence spectrophotometer that permits surface photometry. We prepared 3 samples with distinctly distributed fluorescence spectra and uniform surfaces exhibiting no intra-surface distribution. The results, shown in Fig. 8, confirm that the predictions of our model agree well with known fluorescence spectra for all samples—including samples with different fluorescence wavelengths.
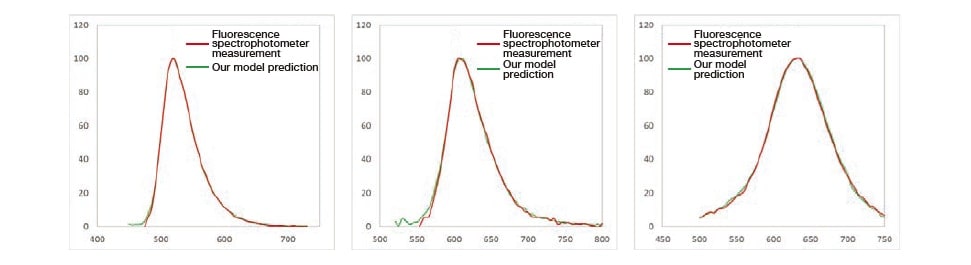
Fig. 8 Validation results for fluorescence spectra
As an actual measurement sample we chose a fluorescent reflecting sheet. In addition to exhibiting fluorescence, the sheet is endowed with fine-grained structure to improve visibility.
We irradiate the sample at a series of single wavelengths, spaced at intervals of 25 nm throughout the range 400-700 nm, and capture three-dimensional fluorescence spectra and camera images at each irradiating wavelength (Fig. 9). We observe a spot on the sample with a diameter of 20 mm. The surrounding environment corresponds to the inner walls of an integrating sphere coated with barium sulfate. From the three-dimensional fluorescence spectra we determine that this sample is excited by wavelengths in the range 400-500 nm. Inspecting the captured images, we observe green fluorescence emissions in sample images taken in this range of excitation wavelengths. On the other hand, at excitation wavelengths longer than 500 nm, the sample color tone is similar to that of its surroundings, indicating the primacy of reflected components and the absence of fluorescence. The sample images captured at excitation wavelengths of 460 and 500 nm, at which the sample fluoresces, reveal green fluorescent light emissions from the entirety of the sample surface. Meanwhile, in the sample images captured at 520 and 580 nm—at which the sample does not fluoresce—we see a division into bright regions of strong reflectance and dark regions of weak reflectance. Although the fluorescence has little directional dependence and is emitted from all parts of the sample surface, the reflection is directiondependent and exhibits a distribution reflecting the underlying sample structure.
Next, Fig. 10 shows results of separation using our algorithm. Enlarged images reveal that the period of the fine-grained structure of the reflecting slab is approximately 200 μm. In these images, reflected and fluorescent components appear respectively orange and green, in agreement with the spectral colors corresponding to reflection and fluorescence spectra. We attribute the yellow appearance of this sample to the superposition of orange reflected
light and green fluorescent light. Also, in the observed images without component separation, the image pattern begins to change at wavelengths beyond the threshold wavelength of approximately 520 nm, at which fluorescence ceases; similar patterns are obtained in the reflection and fluorescence images produced by our separation process. The fact that monochromatic irradiation at different wavelengths yields different image patterns indicates the presence of contributions from both reflected and fluorescent components; we have successfully demonstrated the effectiveness
of inspecting separated reflection and fluorescence images for cases in which the sample exhibits an intra-surface distribution.
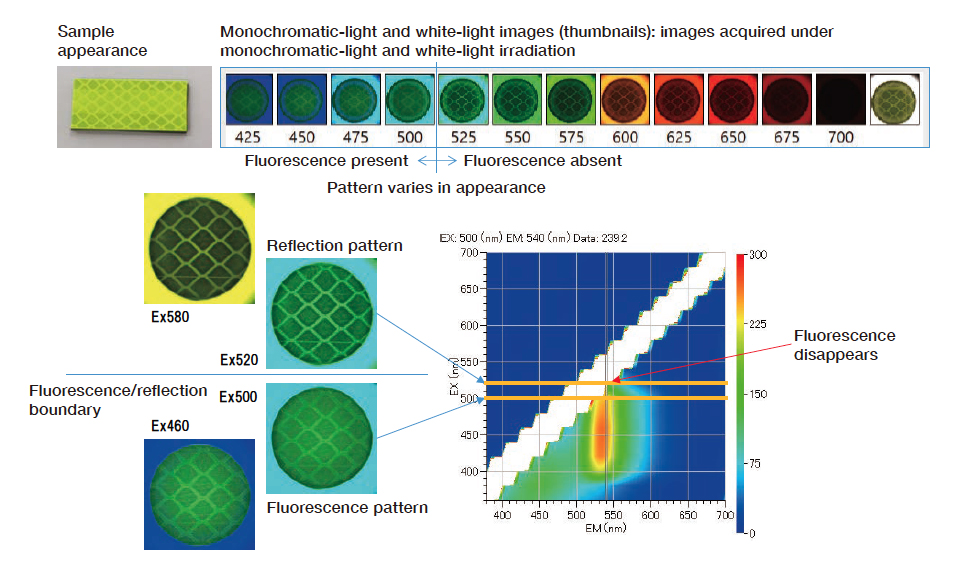
Fig. 9 Captured images and 3-dimensional fluorescence spectra at various wavelengths
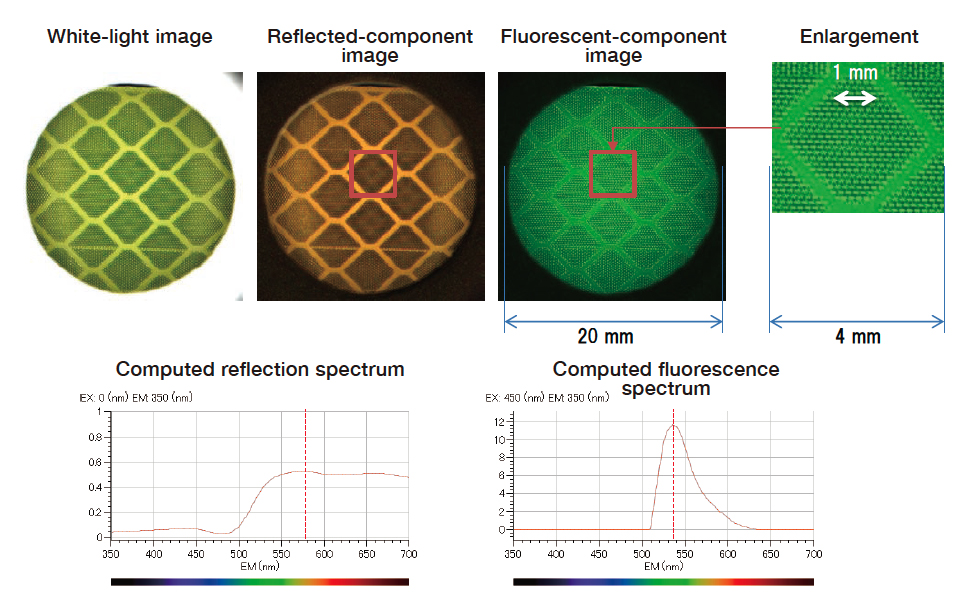
Fig. 10 Separation of reflection and fluorescence spectra for fine-grain structured material
A fluorescence spectrophotometer is a powerful tool for analyzing the fluorescence properties of samples, such as the wavelength characteristics from excitation and emission spectra. Although conventional methods of spectral analysis are restricted to characterizing the average optical properties of specific sample regions, this newly developed method using CMOS cameras allows the spatial distribution of spectral properties on a sample surface to be determined. Combining these tools with image-separation algorithm enables a wide range of new analytical possibilities, including separation of the reflection and fluorescence images and region-specific spectral compositions.
About the authors
*1 Imari Sato
Ph.D. (Interdisciplinary information studies)
Professor, National Institute of Informatics
Visiting Professor, Department of Information and Communications Engineering, School of Engineering, Tokyo Institute of Technology
Professor, Department of Computer Science, Graduate School of Information Science and Technology, the University of Tokyo
*2 Yinqiang Zheng
Ph.D. (Engineering) Associate Professor, National Institute of Informatics
Associate Professor, the Graduate University for Advanced Studies
*3 Jun Horigome
Hitachi High-Tech Science Corporation
*4 Hiroki Okawa
Hitachi High-Tech Science Corporation
See more
