
Kiminori Toyooka
Ph.D. (Science)
Mass Spectrometry and Microscopy Unit
Technology Platform Division
RIKEN Center for Sustainable Resource Science (CSRS)
To know accurately the function of functional molecules such as proteins in vivo, it is necessary to clarify the intracellular localization of organelles and cells. For example, the intracellular localization and dynamics of specific proteins have been easily observed by fluorescence live-imaging using green fluorescent protein (GFP) in recent years. When intracellular ultrastructural information exceeding the resolution of optical microscopy is required, electron microscopy observations are necessary. However, the visible light region used for fluorescence imaging cannot be detected by an electron microscope. In this case, localization can sometimes be performed using immunoelectron microscopy with antibodies as fluorescent tags1). However, depending on the nature of the antibodies or antigens, immunoelectron microscopy may not be possible. Also, it is an advanced technique that requires an experience operator. In addition, it is difficult to conclude that a structure in which gold particles are localized is the same as the structure that emits fluorescence, and it is only possible to perform an estimation. To obtain definitive results, it is necessary to perform electron microscopy observations of the same samples from which fluorescence from GFP or other markers was observed. The technology that makes this possible is known as correlative light and electron microscopy (CLEM).
CLEM is an analytical technique that superposes optical and electron micrographs of identical sample regions. Optical micrographs allow visualization of the local positions and distributions of molecules—of tissues dyed with fluorescent agents or coloring agents—over wide areas. On the other hand, electron microscopes allow visualization of ultra-fine morphology that cannot be seen in optical microscopes. By combining these two techniques, CLEM provides highly convincing confirmation data representing both molecular localization in specific fields of view, and information on microscopic morphology. CLEM variants include combinations of immunostaining or chemical tissuestaining methods with transmission electron microscopy (TEM) or scanning electron microscopy (SEM) for biological specimens, as well as combinations of reflected-light microscopy with SEM for specimens in materials science. To date, many CLEM methods have been reported in the literature and presented by microscope vendors. In our opinion, the optimal CLEM system would enable rapid and accurate correlations between optical and electron micrographs produced by instruments from any manufacturers. In this article, we present MirrorCLEM—a CLEM system developed in collaboration with Hitachi High-Tech Corporation to support both SEM and TEM—and discuss several application case studies.
Our first attempts at implementing CLEM techniques used a field-emission SEM (FE-SEM) system for electron microscopy; however, we found it extremely difficult to use FE-SEM to search for the same sample region in fluorescent images captured by optical microscopy with a specific field of view. Through intensive efforts—referencing the shapes of sample sections and cover slips imprinted with labeled grids to find the same sample region, using imageprocessing software to superpose fluorescent and FE-SEM images—we were eventually able to produce correlation images, but the process of superposing captured images with identical magnifications and orientations was timeconsuming2). This was our motivation for launching a collaborative R&D initiative with Hitachi High-Tech Corporation to develop the fast, convenient MirrorCLEM system3). As shown in Figure 1, a typical observation involves the following steps. (1) An optical microscope is used to image a resin section or other sample at magnifications ranging from low to high at which the target structure is visible. (2) The MirrorCLEM software is used to generate a single optical-microscope map. (3) Information on the position of the observation is used to synchronize information on the position of the FE-SEM/TEM stage. (4) The MirrorCLEM software uses the external control apparatus of the stage to observe the same sample region via electron microscopy, acquiring and superposing images. The optical/FE-SEM overlay image may also be displayed and tracked in real time. The use of MirrorCLEM allows seamless observation and image capture in which optical micrographs and the electron-microscope stage together give the impression of looking into a mirror, allowing efficient generation of correlation images. In what follows we present several application case studies of MirrorCLEM—first with SEM, then with TEM.
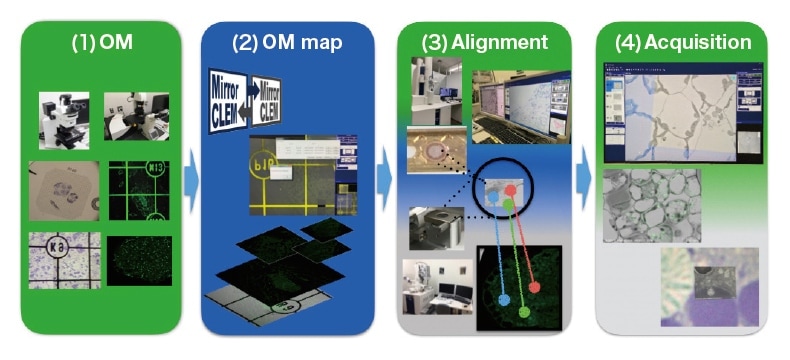
Fig. 1 Workflow diagram illustrating the MirrorCLEM system for CLEM
(1) Optical microscope [OM]
(2) Creation of optical-microscope map [OM map]
(3) Position alignment [Alignment]
(4) Correlation image acquisition [Acquisition]
In recent years, performance improvements in SEM electron guns and detectors have enabled the technique of “section SEM”, in which resin-embedded sections containing biological samples are mounted on a plate such as a glass slide or wafer and imaged using low accelerating voltage beam and backscattered electron (BSE) detectors, yielding sectional electron micrographs of cells and subcellular organelles of a quality comparable with TEM4, 5). This method makes it easy to acquire images covering wide regions of thick resin sections—with thicknesses of 200 nm or more— without requiring the ultra-thin sections needed for TEM. The use of a field-emission electron gun allows FE-SEM to achieve high-resolution observations with magnifications of several hundreds of thousands; in particular, the Hitachi SU8220 instrument that we use not only acquires high-resolution images at accelerating voltages of 20-30 kV, but also offers high probe currents under ultra-low accelerating voltages of 0.1-1 kV; the instrument is equipped with a standard BSE detector for bright images with an outstanding signal-to-noise ratio and a high-sensitivity BSE detector based on a YAG crystal (YAG-BSE detector)6). Sections with thicknesses of 1 μm or more may be mounted on glass slides, electronically stained, subjected to osmium coating, and imaged using the YAG-BSE detector to enable smooth observations unaffected by static charge7).
The SEM-MirrorCLEM system (Figure 2A) consists of the MirrorCLEM software together with a sample stage accepting glass slides or cover slips typically used in optical microscopy (Figure 2B); the position of fluorescent photographs or other optical micrographs of sample sections on the FE-SEM stage is easily synchronized via the method of three-point alignment to image the fine-grained structure of identical sample regions. Moreover, the X-Y automated stage of the optical microscope may be controlled from MirrorCLEM, allowing the incorporation of optical micrographs with magnifications ranging from low to high; this enables easy position alignment of the FE-SEM stage with optical-microscope maps (Figure 2C).
In MirrorCLEM observations using FE-SEM, sections and similar samples are first observed via optical microscopy to acquire color information and low-magnification images; identical regions of identical samples are then imaged via FE-SEM, and the two sets of images are superposed to yield correlation images. For paper, substrates, and other materials-science samples, one first acquires optical micrographs, then mounts the sample in FE-SEM after metallic coating and adjusts the alignment to easily obtain correlation images. For biological samples, samples are fixed and resin-embedded, and resin-embedded sections prepared using an ultramicrotome or similar instrument are mounted on a glass slide; colorant staining or fluorescence is detected via optical microscopy, after which heavy metal staining and osmium coating are performed, and identical sections are observed via SEM using the FE-SEM BSE detector. Here we present three methods distinguished by the type of biological sample and the purpose of the analysis.
Semi-thin sections with a thickness of 500 nm-1 μm are prepared from a resin block for morphology observations using osmium-fixed samples, and affixed to glass slides. After TB staining, an upright microscope or similar instrument is used to acquire low- and high-magnification images of the target field of view (FOV). Thereafter, uranyl acetate solutions and lead citrate solutions are used to perform heavy metal staining, followed by osmium coating. Optical micrographs ranging from low to high magnifications are read by MirrorCLEM and used to create an opticalmicroscope map. Glass slides are mounted on the SEM sample jig and MirrorCLEM is used to achieve three-point alignment of the section with the optical-microscope map. This ensures that, when the optical-microscope map is moved, the stage moves to the same location, while enlarging the optical-microscope map enlarges the SEM image by the same magnification; image acquisition then automatically saves the SEM image on the optical-microscope map. For example, capturing FE-SEM images of a TB-stained section of a mung bean germinated cotyledon allows one to observe subcellular organelles—not visible via optical microscopy—while tracking the observation position via optical microscope (Figure 2-[1]).
Animal adherent cells are pasted into a gridded cover slip (the printed side), fixed with glutaraldehyde, and observed via confocal laser microscopy to obtain fluorescent and scanning images, including low-magnification images with alphanumeric grid labels and high-magnification images containing the target FOV. The next steps are osmium fixing, dehydrating, and embedding in epoxy resin. When the cover slip is peeled from the resin, alphanumeric labels and indentations/protrusions remain, and these are used as guideposts to trim sections to ultra-thin dimensions retaining the regions imaged by optical microscope. The sections are mounted on glass slides, subjected to metal staining with uranyl acetate and lead citrate, and osmium coating, aligned as in [1] via MirrorCLEM using cells and grid frames as guides, and then observed to yield correlation images (Figure 2-[2]). Using this method, we successfully conducted a CLEM analysis of keratin labeled by red fluorescent proteins using primary cell cultures for mouse skin cells8).
To observe the localization of fluorescent proteins such as GFP in tissues and suspension cells that cannot be mounted on glass slides, we perform resin embedding and ultra-thin section-slicing while preserving fluorescent regions. The sections are mounted on gridded cover slides and subjected to fluorescence observation, after which the same sample regions are observed using a MirrorCLEM-equipped FE-SEM system (Figure 2-[3]). For example, we attempted CLEM using transformed Arabidopsis plant seedlings containing GFP-labeled ER bodies (granules derived from endoplasmic reticulum) or GFP-labeled peroxisomes. We aldehyde-fixed seedlings, embedded them in the acrylic resin LR White resin after dehydrating, prepared semi-thin sections (thickness 1 μm), mounted them on gridded cover slips, and used a confocal laser scanning microscope to acquire fluorescence images. After heavy metal staining, regions of the same sections from which GFP fluorescence was detected were observed using a MirrorCLEM. As a result, we obtained correlation images of fluorescent dots in agreement with spindle-shaped ER bodies or round peroxisomes9).
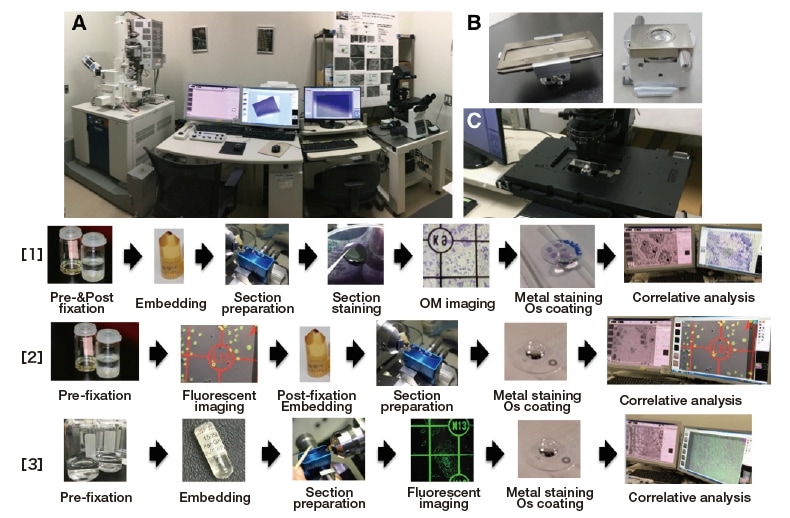
Fig. 2 SEM-MirrorCLEM and associated sample preparation methods.
(A) The MirrorCLEM system at our facility, consisting of a MirrorCLEM-equipped SU 8220 and an inverted microscope equipped with an
automated stage.
(B) FE-SEM sample jigs for glass slides or cover slips.
(C) Optical microscope automated stage controlled by MirrorCLEM.
[1–3] Workflows for correlative analysis of biological samples, distinguished by the type of sample and the objective of the analysis.
The MirrorCLEM system can control the latest TEM instruments, such as Hitachi’s HT7800 (Figure 3A), which enables the reading of images acquired by an optical microscope, after which 3-point alignment (Figure 3B) may be used to find regions of interest in optical micrographs within the TEM system, or the electron microscope can be used to identify the sample region observed by the optical microscope. The captured electron micrograph of the same region as in the optical micrograph can then be saved. This procedure not only yields correlation images, but also allows optical micrographs and electron micrographs to be linked together and saved, which is an extremely convenient feature. Here we will present three detailed case studies: [1] CLEM with semi-thin and ultra-thin sections, [2] CLEM with fluorescent nanoparticles on a TEM grid, and [3] CLEM with fluorescent protein images of ultra-thin sections mounted on a TEM grid.
This is a TEM-CLEM method for acquiring correlation images using serial sections of samples; it obtains correlation images using images of a semi-thin section mounted on a glass slide, followed immediately by images of an ultra-thin section mounted on a TEM grid. For example, to observe subcellular organelles in an Arabidopsis pod subjected to highpressure freezing / freeze substitution, we first prepare semi-thin sections of a sample embedded in a resin block, then TB-stain a single section and use an upright microscope to capture low-magnification and FOV high-magnification photographs. Then we use a razor blade to trim the section—retaining the FOV-containing portion—to prepare several ultra-thin sections with thicknesses of 80-100 nm. These are mounted on a TEM grid, stained with heavy metal, placed in the MirrorCLEM-equipped HT7800, and subjected to an alignment procedure to acquire images of the same sample region with ease (Figure 3-[1]). By superposing TB and TEM images and displaying the results, we successfully determined which regions of the pod to enlarge in captured images to identify Golgi bodies and mitochondria (Figure 3[C]).
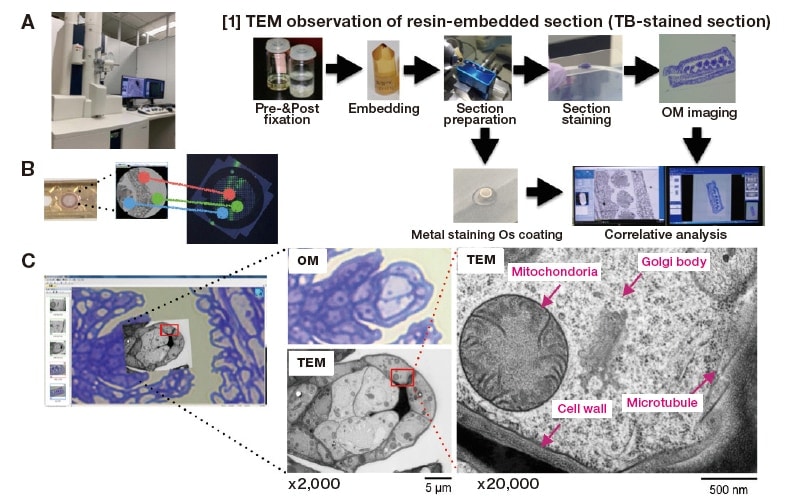
Fig. 3 TEM-MirrorCLEM and associated sample-preparation method.
(A) MirrorCLEM-equipped HT7800
(B) Three-point alignment of TEM grid with optical micrograph.
(C) TB-staining image and MirrorCLEM image of an Arabidopsis pod subjected to high-pressure freezing / freeze substitution.
[1] Workflow for TEM observation of resin-embedded section (stained section)
Nanoparticles and other particles emitting fluorescence are mounted on a TEM grid and subjected to fluorescent imaging, then negatively stained and observed via TEM-MirrorCLEM. For example, in the case of fluorescent beads, the beads are mounted in a Formvar support film TEM grid processed by water immersion, and then dried. The grid is sandwiched between a glass slide and a cover slip and imaged by confocal laser scanning microscopy to yield fluorescence and scanning images. After negative staining using an uranyl acetate, TEM-MirrorCLEM is used for alignment, after which CLEM images are acquired (Figure 4-[2]). In this way, we succeeded in using TEM to distinguish beads that emit green fluorescence from those that do not.
An embedded resin block, mildly fixed to retain GFP fluorescence, was prepared9) and ultra-thin sections with thicknesses of 100-200 nm were sliced and mounted on a TEM grid with alphanumeric labels. Slices were sandwiched between a cover slip and a cover slip 35-mm bottom dish filled with an antifade reagent to restore fluorescence, and a confocal laser scanning microscope equipped with a high-sensitivity detector was used to capture fluorescence and scanning images9). Then slices were stained with heavy metal and TEM-MirrorCLEM was used to capture CLEM images (Figure 4-[3]). For example, identical regions of resin-embedded ultra-thin sections of GFP-labeled peroxisomes in Arabidopsis cotyledons mounted on a TEM grid with alphanumeric labeling in high-sensitivity confocal laser scanning microscope images may be searched via MirrorCLEM (Figure 4A) to yield TEM images superposed with fluorescent images (Figure 4B). The images successfully distinguish which structures are peroxisomes.
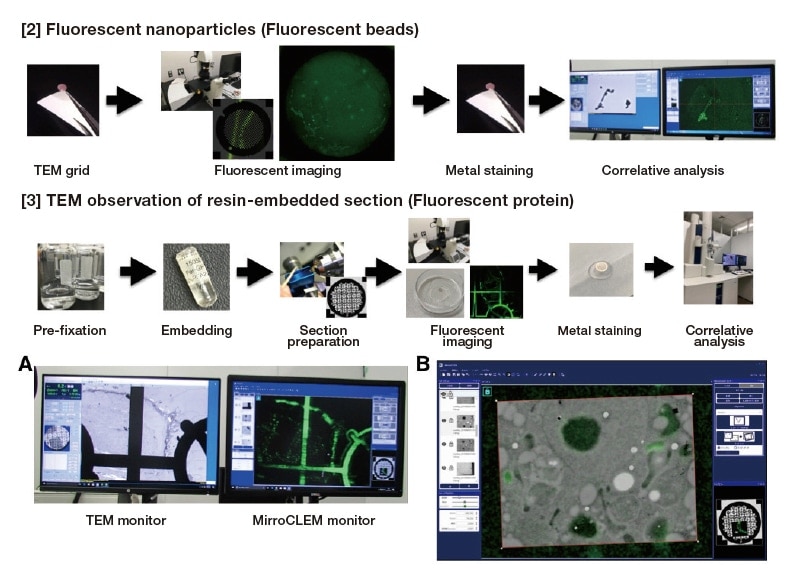
Fig. 4 Method of TEM-MirrorCLEM sample preparation.
[2] Workflow for correlation image capture of fluorescent nanoparticles on TEM grid.
[3] Workflow for CLEM using TEM with GFP fluorescence.
(A) TEM monitor and MirrorCLEM monitor windows during observations of identical sample regions.
(B) MirrorCLEM window showing superposition of confocal laser scanning microscopy image and TEM image of identical regions of a GFP-labeled peroxisome.
MirrorCLEM is a seamless system for electron microscopy with the ability to determine correlations for a wide variety of images, offering easy identification of fine-grained structures containing localized fluorescent proteins and colorants. In recent years it has become possible to image identical sample regions at similar resolutions via optical and electron microscopes, while improvements in confocal laser scanning microscopy and FE-SEM detectors have enabled high-sensitivity detection of signals that were previously unobtainable. Going forward, we are hopeful that the combination of MirrorCLEM with three-dimensional analysis methods such as confocal laser scanning microscopy serial-section SEM will enable elucidation of three-dimensional local features in target proteins with ultra-fine resolution. Moreover, the use of MirrorCLEM in combination with high-pressure freezing / cryo-electron microscopy and various other new technologies to observe ultra-fine morphologies from multiple viewpoints gives extraordinarily clear insight into the distributions and behavior of biomolecules, offering powerful tools for understanding biological phenomena.
References
Acknowledgements
In developing this system, we received immensely valuable assistance from the team at Hitachi High-Tech Corporation, from the team at Astron Inc., and from Ms. Naeko Narikawa, Dr. Yuki Hamamura, Ms. Mayumi Wakazaki, and Dr. Mayuko Sato at RIKEN CSRS. In addition, we received GFP-expressed Arabidopsis seeds from Dr. Shoji Mano of the National Institute for Basic Biology, and primary cell cultures for GFP-expressed mouse skin cells from Dr. Takeshi Matsui, Dr. Keiko Usui, and Mr. Hachiro Iseki at RIKEN IMS. We express our gratitude to all. This work was supported by KAKENHI grants for Scientific Research on Innovative Areas (17H06475) and Scientific Research C (17K07477).
See more
