Hidehiro Takahashi*1, Kenichi Shibata*2
Thermogravimetry (TG) is a thermal analysis technique that is useful for evaluating thermal characterization of materials, predicting material lifetimes, and quantifying the composition of samples. In TG measurements, a sample is placed inside a temperature-controlled furnace, the temperature is held fixed or increased at a constant rate, and changes in the sample mass—associated with phenomena such as sample decomposition, sublimation, evaporation, and oxidation reactions—are monitored as a function of time or temperature.
However, in many cases the information obtained from TG measurements does not suffice to identify the causes of sample mass variations. For this reason, TG analysis is often combined with differential thermal analysis (DTA) or differential scanning calorimetry (DSC), becoming popular hybrid methods known as TG/DTA or TG/DSC.
Furthermore, in recent years TG/DTA which combined digital camera, are drawing attention. This system can observe images of the sample during measurement of TG/DTA. These images bring new information to the result of TG/DTA.
Since the 1970s, Hitachi has been developing—and delivering to customers around the world—our own line of differential horizontal balance TG/DTA instruments. In 2013, we released Real View®, a differential horizontal balance TG analyzer that represented the world’s first sample-observation TG/DTA system. The newest series, which represents the 7th generation of instruments in this product line, is known as the NEXTA® series, and consists of three TG/DSC systems equipped with DSC measurement capabilities: the STA200, STA200RV, and STA300, all recently
released. The left panel of Figure 1 shows the STA200RV with an attached sample observation unit.
Reading mass difference before and after the reaction is operated as TG analysis, and determine component ratio. When there are any mass variation from instrument itself—we call it baseline—reading mass difference include error. Thus, baseline performance is a key factor in achieving high measurement accuracy. Our latest series of instruments is equipped with new balance stabilization technology designed to improve baseline performance.
In this note, we describe the new technological features we have incorporated into the NEXTA® series and present application that showcase the unique capabilities of these instruments.
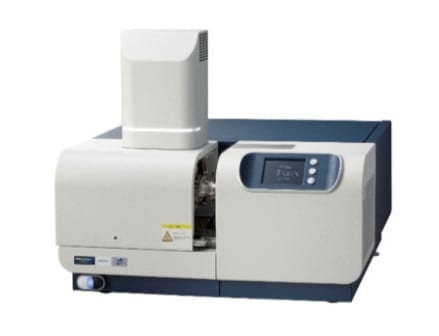
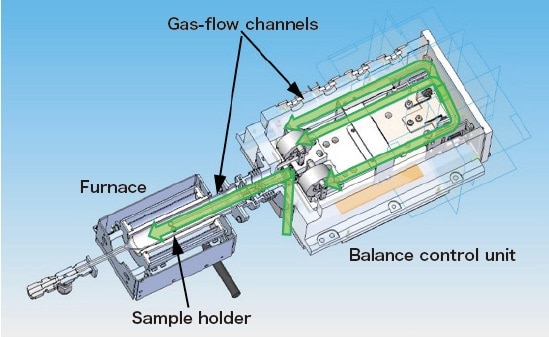
Fig. 1 The NEXTA® STA (left) and a conceptual diagram of the balance mechanism (right).
The NEXTA® STA maintains the balance control unit at a uniform temperature at all times to achieve a stable baseline, as detailed in Table 1.
Figure 2 plots TG baselines as measured by a NEXTA® STA instrument and a conventional model under identical conditions. Evidently the NEXTA® STA exhibits less drift than the conventional model.
As shown in Figure 3, the reduction in baseline drift allows even minuscule reductions in sample mass—on the order of 1%—to be captured with high accuracy.
Table 1: Key specifications of the NEXTA® STA
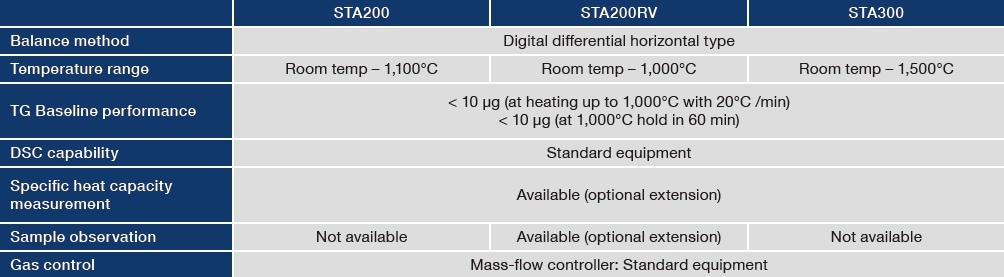
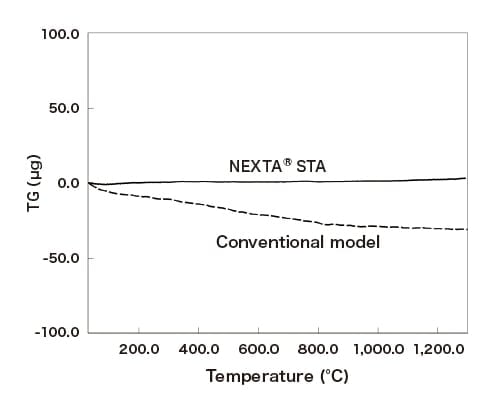
Fig. 2 Baseline stability.
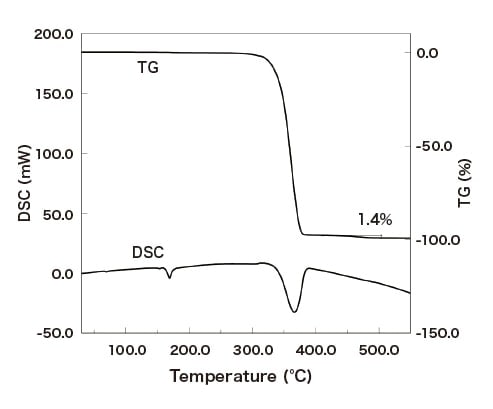
Fig. 3 A case study of quantifying minuscule adulteration amount.
TG measurements are typically conducted in the presence of a gas flow, and the choice of flow gas affects the reactions that take place at the sample.
For the measurements of metallic samples, slight residual oxygen at the measurement environment might cause oxidation of sample and might inhibit the sample’s usual reactions. Also, in some cases involving polymer samples, the temperature at which decomposition begins is affected by the oxygen concentration.
The horizontal-balance configuration employed by Hitachi’s TG instruments offers outstanding gas-exchange properties and has enabled the use of greater gas flows than is possible for other types of balance. Moreover, we have optimized the gas-flow channels of NEXTA® STA instruments to achieve still further improvements in gas-exchange performance compared to conventional model—allowing residual oxygen concentrations to be reduced to less than 5 ppm without any options, such as vacuum.
Figure 4 shows measured results for a sample of iron powder heated to 1,400°C in a nitrogen environment. In comparison to measurements made by a conventional model, TG measurements made by NEXTA® STA indicate essentially no change in mass, indicating sufficiently low concentration of residual oxygen in the measurement environment. Further evidence indicating the non-oxidation of the sample is furnished by the fact that the temperatures of peak transitions read from the DSC chart agree with the known values of transition peaks for pure iron.
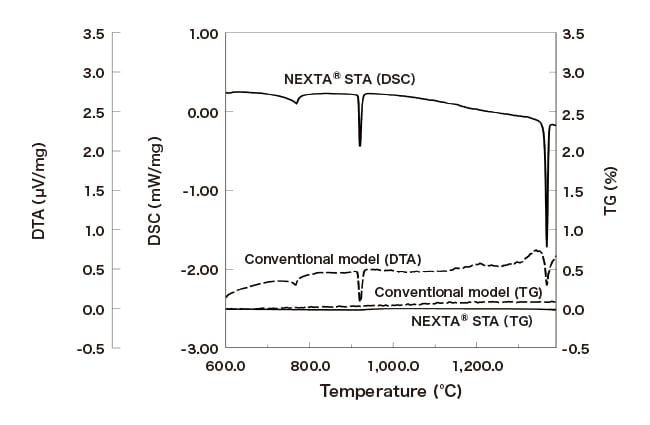
Fig. 4 STA measurements of an iron-powder sample.
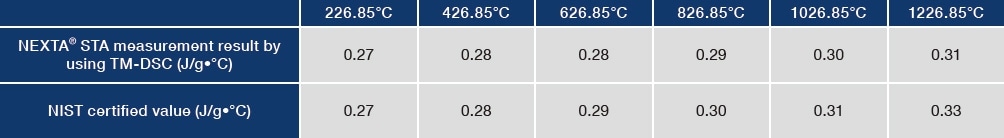
NEXTA® STA instruments offer support for temperature-modulated DSC (TM-DSC), a measurement technique in which a small sinusoidal temperature modulation is superposed atop a constant rate of temperature increase. It is possible to convert to specific heat capacity from the data measured via this technique.
Figure 5 shows measured data for a molybdenum sample prior to software processing. Figure 6 and Table 2 compare specific heat capacity values computed from these measurements to certified values from NIST1). It is clear that the results of TM-DSC measurements are in excellent agreement with certified values.
On general-purpose DSC, 3 times testing, meaning three data—one for baseline, one for reference, one for sample —is required for calculating to specific heat capacity. In comparison to this conventional procedure, TM-DSC specific heat capacity measurements using an NEXTA® STA instrument offer the following advantages.
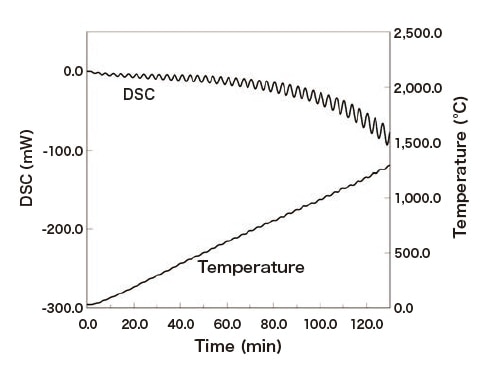
Fig. 5 Measurement data via TM-DSC
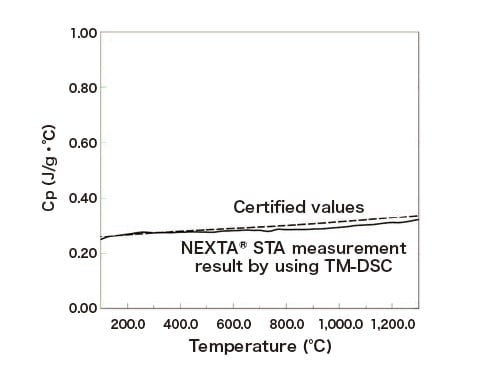
Fig. 6 Specific heat capacity of molybdenum
Table 2: Specific heat capacity of molybdenum at various temperatures.
Hitachi’s Real View® sample-observation thermal analysis feature allows observation of samples while thermal analysis measurements are in progress, which was not possible with general TG instruments. Because the images acquired by sample observation are synchronized to thermal analysis data, it is easy to display sample images, for example, at the peak top of DSC.
The Real View® capabilities of previous instruments of Hitachi were not limited to simple observations, but rather offered a sequence of functional improvements such as digital-zoom support and length-measurement functionality. To these existing features, the NEXTA® series adds new capabilities for color analysis of acquired images. Color analysis is a technique in which the color hues present in an arbitrarily-selected region of a sample image are represented by numbers—for example, by three values representing red (R), green (G), and blue (B). The NEXTA® series supports not only RGB color analysis, but also the CMYK and LAB color schemes as well.
In the past, the investigation of sample color variations during measurements was limited to qualitative analysis via human visual inspection. In contrast, the new color-analysis capabilities of the NEXTA® series allow quantitative characterization of sample color variations.
Figure 7 shows measurements for a sample of copper sulfate pentahydrate. While heating, this material is wellknown to exhibit a multi-stage process of mass reduction via dehydration. From the sample images acquired during the dehydration process, we see that the sample—which is a bright blue color at room temperature—gradually loses its brilliance at higher temperatures and turns from blue to white. Also plotted in the figure are the R, G, and B signals obtained via color analysis of sample images.
All colors may be represented as a combination of R, G, and B values; note that the numerical R, G, B values observed near room temperature differ significantly from the values observed after the first mass-reduction step (at times a round the range 10-20 minutes). At higher temperatures, for which all hydrates are expected to have been dehydrated, the acquired image appears grey to the naked eye; however, from the RGB signals we see that in fact the sample retains some B (blue) components.
In this case, we numerically quantified color variations associated with the process of dehydration of an inorganic substance; however, STA measurements of polymers frequently measure thermal decomposition. In this case, white or transparent polymers turn yellow and begin to carbonize at higher temperatures; we expect the color-analysis capabilities to offer great promise for characterization of this process.
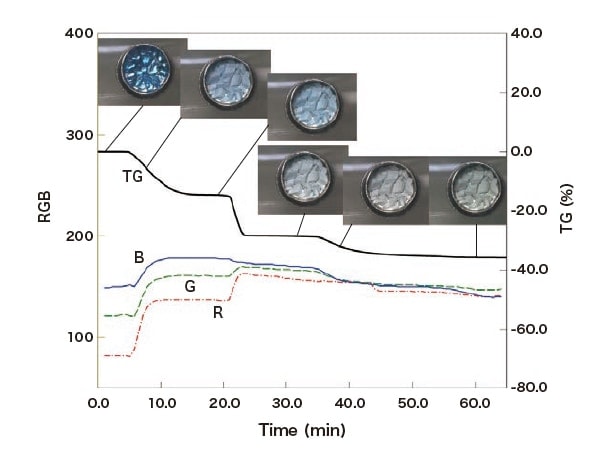
Fig. 7 A case study of color analysis for sample-observation TG measurements.
The NEXTA® STA series of instruments offer excellent baseline performance, improved gas-exchange performance, DSC support, and sample-observation capability. These systems are ideal for researchers who have struggled to achieve adequate measurement accuracy or have encountered problematic oxidation reactions due to residual oxygen present during measurements. The new color-analysis capability incorporated into Real View® allows quantitative characterization of sample color variations in software, offering promising applications to an expanded range of metrological objectives.
References
NEXTA and Real View are registered trademarks of Hitachi High-Tech Science Corporation in Japan and other nations.
Publication data
Published in the monthly journal Engineering Materials (October issue 2019)
About the authors
Application Development Center
Hitachi High-Tech Science Corporation
Marketing Division
Hitachi High-Tech Science Corporation
See more
