Daisuke Koga
Ph.D.
Associate Professor of Department of Microscopic
Anatomy and Cell Biology
Asahikawa Medical University
In recent years, techniques involving three-dimensional (3D) reconstruction of consecutive scanning electron microscopy (SEM) images of resin-embedded specimens have been the subject of increased attention for the structural analysis of biological specimens. Such techniques include FIB/SEM,1,2) which is a block-face observation method using a focused ion beam (FIB), and serial block-face SEM (SBF/SEM),3) in which an ultramicrotome is installed inside an SEM system. There have also been reports on 3D reconstruction of SEM images of serial ultrathin sections mounted on a rigid substrate such as glass.4-7) This is commonly referred to as serial-section SEM (or array tomography), and it offers a number of advantages over other imaging methods. First, the complex grid manipulation required for serialsection transmission electron microscopy (TEM) is not required, allowing serial ultrathin sections to be collected with ease. In addition, wide areas of the samples can be observed at one time, and any given section can be re-observed any number of times if necessary. In this report, we provide an introduction to serial-section SEM and discuss its application to the 3D structural analysis of the Golgi apparatus.
Serial-section SEM is a technique in which serial ultrathin sections are mounted on a rigid substrate, and images of these sections are obtained by SEM (Fig. 1). Here, we describe the various steps of serial-section SEM for the Golgi apparatus.8),9)
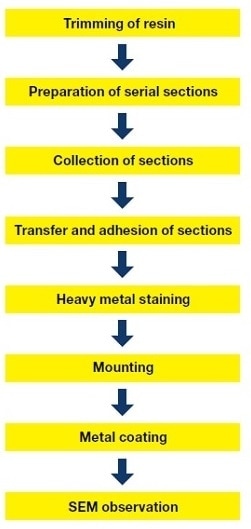
Fig.1 Flowchart showing sample preparation procedure for serial-section SEM.
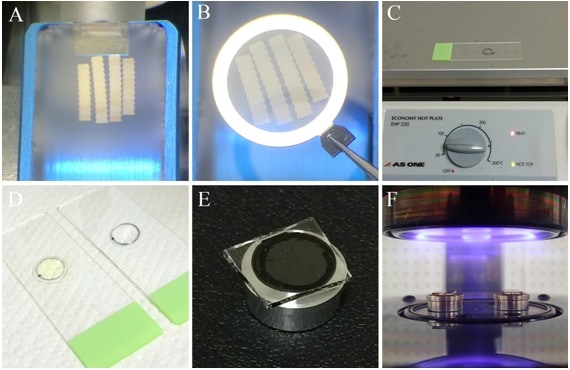
Fig.2 Serial-section SEM.
A. Four aligned ribbons of serial sections. Each ribbon consists of roughly 15 sections, so the number of samples that can be acquired at once is approximately 50.
B: Collecting sections using the iron ring.
C: Adhesion of sections. The slide is heated for approximately 30 min on a hot plate (60°C).
D: Staining with uranium and lead. It is easy to apply heavy metal staining to sections mounted on glass slides.
E: Mounting. After being cut to a predetermined size using a diamond pen to make cracks, the slide is mounted on the aluminum SEM sample stub.
F: Metal coating. To prevent artifacts due to charging of the specimen, a platinum/palladium coating is applied.
Figure 3A shows a BSE image of an ultrathin section of an osmium-stained Golgi apparatus, and Fig. 3B shows a black-white inversion of the same image. The black-white inversion of the BSE image exhibits contrast that is similar to that in TEM images. In Fig. 3B, osmium deposits are visible in the cisterna on the cis side of the Golgi apparatus, due to a higher BSE intensity. Similarly, by double staining with uranium and lead, it is possible to observe cellular organelles such as the endoplasmic reticulum, mitochondria, nuclei and secretory granules.
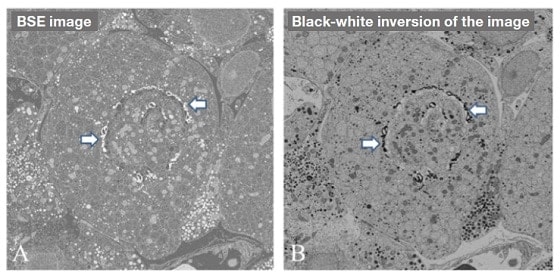
Fig.3 Ultrathin section of osmium-stained Golgi apparatus.
A: BSE image.
B: Black-white inversion of Fig. A. By performing a black-white inversion of the BSE image of the section, we obtain an image similar to that which would be obtained by TEM. Osmium deposits are visible in the cis-Golgi cisterns (arrows).
After serial sections have been observed by SEM, 3D reconstruction of the target structures must be performed. Here, we briefly introduce the 3D reconstruction method, which is schematically illustrated in Fig. 4.
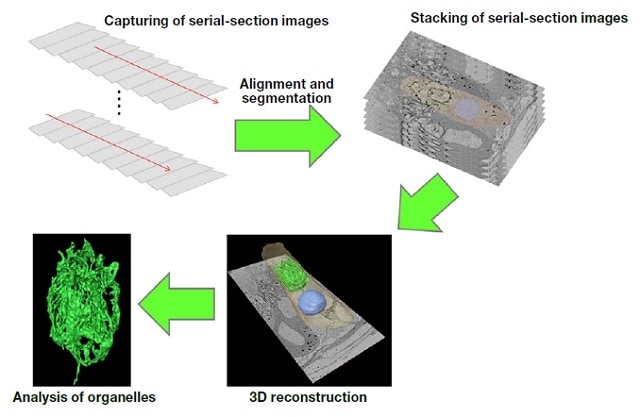
Fig.4 Procedure for 3D reconstruction of serial-section images.
Figure 5A shows 3D reconstructed images of the nucleus, the cytoplasm, and the Golgi apparatus in an epithelial principal cell in a rat epididymis. In the cell, 150 ultrathin serial sections were used to produce a 3D reconstructed image of the Golgi apparatus. The Golgi apparatus is located in a large region of cytoplasm between the juxtanuclear region and the lumen. Fig. 5B shows closer view of the 3D reconstruction of the Golgi apparatus in Fig. 5A, and its spatial complexity is clearly evident. Although the continuity of the Golgi cisterna cannot be determined based on observations of a single ultrathin section, it is very clear in the 3D reconstructed image. By combining serial-section SEM and 3D reconstruction techniques, it is therefore possible to analyze the overall shape of the Golgi apparatus with the spatial resolution of electron microscopy.
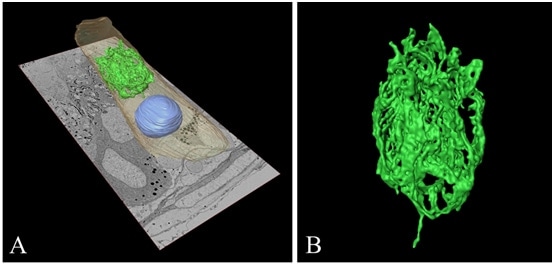
Fig.5 3D reconstructed images of the Golgi apparatus in an epithelial principal cell in a rat epididymis.
A: Golgi apparatus (green), nucleus (blue), and cytoplasm (brown) in the cell.
B: Closer view of the Golgi apparatus showing complex cisterna that resemble the petals of a tulip.
Serial-section SEM offers a number of advantages over other techniques. Here, we discuss some of the merits of this method.
In serial-section SEM, the resolution in the x-and y-directions, i.e., the section plane, is determined by the instrument used, whereas the resolution in the z-direction depends on the thickness of the sections. The z-direction resolution is inferior to that of FIB/SEM, because in serial-section SEM, a section thickness of 100 nm is thought to be best for creating a stable ribbon of serial sections, whereas the milling pitch can be as little as 10 nm per step in FIB/SEM. In addition, since image alignment is essential in serial-section SEM, it is important to perform accurate alignment procedures in order to obtain high-quality 3D reconstructed images.
The osmium-maceration method, an imaging technique developed more than 30 years ago by the group of Professor Keiichi Tanaka at Tottori University, is a useful method for imaging cellular organelles by SEM.10), 11) Using this method, we have studied the 3D ltrastructure of cell organelles (Fig. 6A). In the osmium-maceration method, because the cracked surface of cells is observed by SEM, it is useful for analyzing the 3D ultrastructure of the cristae of mitochondria, ribosomes on the cisterna of the endoplasmic reticulum, and the cisterna of the Golgi apparatus. However, it is difficult to determine the overall shape of the Golgi apparatus and the endoplasmic reticulum, which are located in a large region of cytoplasm (Fig. 6B). Therefore, we came to feel strongly that serial-section SEM was a crucial technique for solving this problem. Because there were no nearby facilities where we could perform FIB/SEM or SBF/SEM observations, we developed an original method of applying serial-section SEM to the Golgi apparatus. By repeated trial-and-error over the course of approximately one year, we eventually succeeded in obtaining serial sections. As a result, we were able to image the overall shape of the Golgi apparatus, only the cracked surface of which could be observed by the osmium-maceration method, with the spatial resolution of electron microscopy.
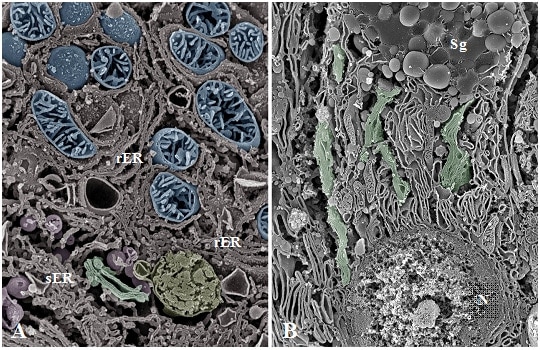
Fig.6 SEM images of osmium-macerated tissues.
A: Osmium-maceration image of hepatocyte. The cracked surfaces of the mitochondria (blue), the rough/smooth endoplasmic reticulum (rER/sER), and the Golgi apparatus (green) are observed.
Cristae are also identified within the matrix space of the mitochondria.
B: Osmium-maceration image of a goblet cell in the rat jejunum. Because the cracked surfaces of cells are being observed, the continuity of the Golgi cisternae is not discernible, and it is difficult to analyze the overall structure of the Golgi apparatus (green). Sg: Secretory granules. N: Nuclei.
Finally, we would like to discuss our opinions regarding the osmium-maceration and serial-section SEM methods. The osmium-maceration method allows direct observation of the 3D ultrastructure of organelles such as mitochondria and the Golgi apparatus without 3D reconstruction. In contrast, in serial-section SEM, computer software is used to reconstruct serial-section images. It must therefore be kept in mind that the resulting 3D image is ultimately nothing more than a product created by a computer. On the other hand, because in the osmium-maceration method the cracked surfaces of cells are being observed, it is difficult to use this method to capture the overall shape of structures that are widely distributed throughout the cytoplasm, such as the Golgi apparatus and endoplasmic reticula. In contrast, serial-section SEM can image the overall shape of a single cell. It is therefore possible to analyze the overall structure and continuity of specific organelles. In view of these advantages and drawbacks, we believe the proper question is not "which of these two imaging techniques is better?", but rather "what do you wish to see?" In other words, it is important to choose the appropriate method based on the purpose of the study. Also, in addition to the osmiummaceration method, there are excellent sample-preparation methods that are all-too-easily overlooked, such as the KOH digestion method for observing cellular components hidden in tissues, the alkali-water maceration method for analyzing collagen fiber networks, and the vascular casting method for 3D visualization of the vascular system. In the future, it can be expected that the combination of serial-section SEM and a variety of SEM sample-preparation methods will lead to an expansion of SEM applications in the field of biology.
In this report, we have provided an introduction to serial-section SEM. This method is easier than serial-section TEM and avoids the high cost and specialized equipment characteristic of FIB/SEM and SBF/SEM, while nonetheless yielding 3D reconstructed images that are as accurate as those obtained using these other methods. Serial-section SEM is particularly effective for analyzing the overall 3D configuration of the Golgi apparatus, which has been difficult to achieve until now.
Moreover, although in recent years there has been a rapid increase in interest in SEM by many researchers due to the development of 3D SEM methods such as FIB/SEM, SBF/SEM and serial-section SEM, we must not overlook the fact that the ability to perform direct 3D observations of cells and tissues is one of the fundamental features of SEM.
References
Acknowledgements
The research described in this report was conducted under Professor Tatsuo Ushiki of the Division of Microscopic Anatomy in the Graduate School of Medical and Dental Sciences of Niigata University. In addition, the development of serial-section SEM was completed in collaboration with Dr. Satoshi Kusumi of the Graduate School of Medical and Dental Sciences at Kagoshima University.
See more
