
Naoya Sakamoto
Ph.D.
Assistant Professor
Creative Research Institution
Hokkaido University
Today we find ourselves at the dawn of a grand new era of adventure and discovery in space. The exploration of the
cosmos, once the exclusive province of large-scale national initiatives such as the U.S. Apollo program, has evolved into an arena of vigorous economic competition among a crowded field of players, including both nations—large and small—and corporations; meanwhile, the unabashed pursuit of rocket technology by the world’s wealthiest individuals has accelerated the pace of development so dramatically that the once-unimaginable prospect of human life in space may well become a reality within the present generation.
As we set our sights on new heavenly horizons, precisely what sorts of new destinations will we encounter? When we discover new planets, what will they be made of? Will there be water—and air? What useful resources will be available? In planning and deploying resource-reconnaissance missions and protocols to investigate these questions in new extraplanetary arenas, it will be of great benefit not only to understand the chemical compositions and physical properties of target destinations, but also to develop insight into the large-scale mechanisms governing their formation. To this end, we have used an instrument known as an isotope microscope (Figure 1) to analyze several samples of extraplanetary origin—including meteorites, sand from the surface of the Moon retrieved by Apollo astronauts, and samples from the Itokawa asteroid retrieved by Japan’s Hayabusa space probe—with the goal of understanding the evolution of matter and the formation of our solar system1-4). In this article, we discuss the use of isotope microscopy as a tool for analyzing solar-system formation via isotope analysis of extraplanetary matter.
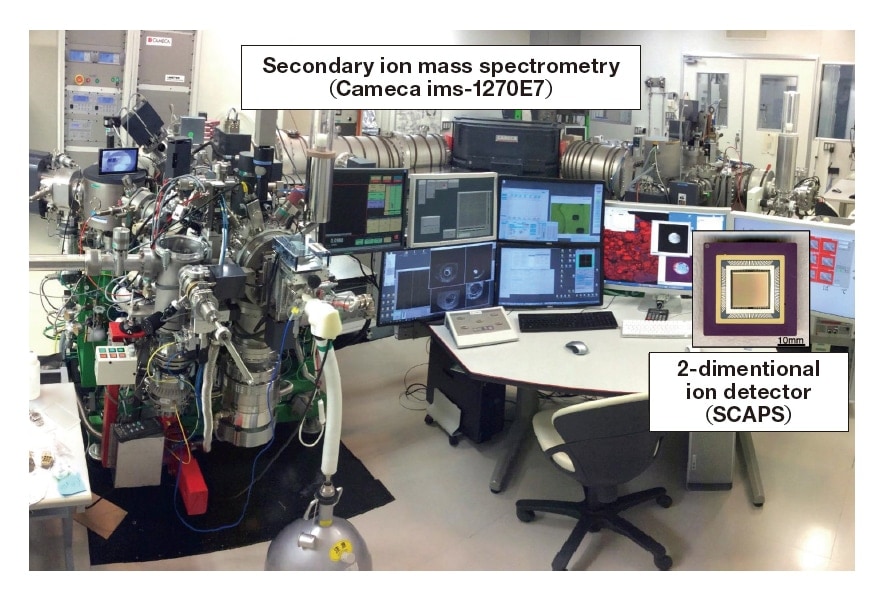
Fig. 1 The isotope microscope used in this study.
An ordinary pebble—found, perhaps, by the side of a road—may appear at first glance to hold no particular mysteries. But this appearance is deceiving, for a typical pebble has the remarkable property that almost every one of its atoms was created before the formation of our solar system in the interior of a distant star via the process known as nucleosynthesis. Eventually, the explosion of the star sent dust clouds of atoms streaming through space, where— influenced by phenomena such as gravitational contraction and collision-mergers between celestial bodies—they underwent evaporation, melting, solidification, and other physiochemical processes, eventually coming to rest by the side of that road on our Earth. The distinct chemical properties of the oxygen, silicon, and other elements present in the pebbles give rise to a wide variety of elemental compositions and proportions depending on temperature, pressure, and other environmental conditions. On the other hand, distinct isotopes of a given element have largely identical chemical properties, whereupon variations in isotope ratios offer straightforward indications of mass differences. For example, when we boil water in a standard household kettle, the mass differences between the three isotopes of
oxygen (16O, 17O, 18O) give rise to slight variations in the velocity and chemical bonding activity of water molecules, with the consequence that the lightest molecules (H216O) preferentially evaporate to form steam, while the water remaining in the kettle grows heavier—with an isotope ratio (17O/16O : 18O/16O) of roughly (1:2), corresponding to the ratio of mass differences between the numerator and denominator. When the steam cools and reverts to the liquid phase, the history of the evaporation process remains encoded in the distribution of light isotopes. The upshot is that, by combining quantities of oxygen and silicon at specific temperatures and pressures, we can create substances whose elemental compositions precisely match those of substances originating in outer space—and which, moreover, retain characteristic “scars” encoding the trajectory along which their isotopic composition evolved over time, making them difficult to counterfeit.
The method of X-ray elemental mapping is widely used to visualize the elemental composition of electronmicroscope samples. The development of analogous techniques for visualizing isotope ratios would enable the detection of exotic substances masquerading as pebbles of conventional matter in blended samples—substances that may be indistinguishable from conventional substances by shape or color, and may be of arbitrary size and elemental compositions, their exotic natures revealed only by the isotope ratio. The isotope microscope we discuss here, an instrument for imaging isotope distributions in solid surfaces, implements just such a technique—and is an invaluable tool for unearthing buried treasures.
Our isotope microscope consists of a direct-imaging secondary ion mass spectrometry (SIMS) and a 2-dimentional ion detector (SCAPS)5). In SIMS, the sample is irradiated with a beam of primary ions—accelerated through voltages
ranging from a few to a few tens of keV— and then a mass analyzer is used to extract isotope information from secondary ions sputtered from the sample surface. The SCAPS secondary-ion detector (Figure 2), a novel CMOS image sensor that we developed ourselves, uses electrode layers stacked atop the outer surfaces of individual pixels to enable direct detection of ions6). Each pixel in the SCAPS detector acts as an integral type detector, achieving a wide dynamic range—4.5 orders of magnitude per pixel—while retaining good linearity7).
By combining the SCAPS detector with magnetic SIMS system8)—which is equipped with an image-capturing ion optical system and can perform mass analysis without loss of information regarding in-sample position—we achieve a system capable of simultaneous mass analysis and imaging, with a spatial resolution that is independent of the probe radius, and with the sample continuously irradiated by a high-current beam of primary ions to yield high-duty-cycle imaging of isotope distributions.
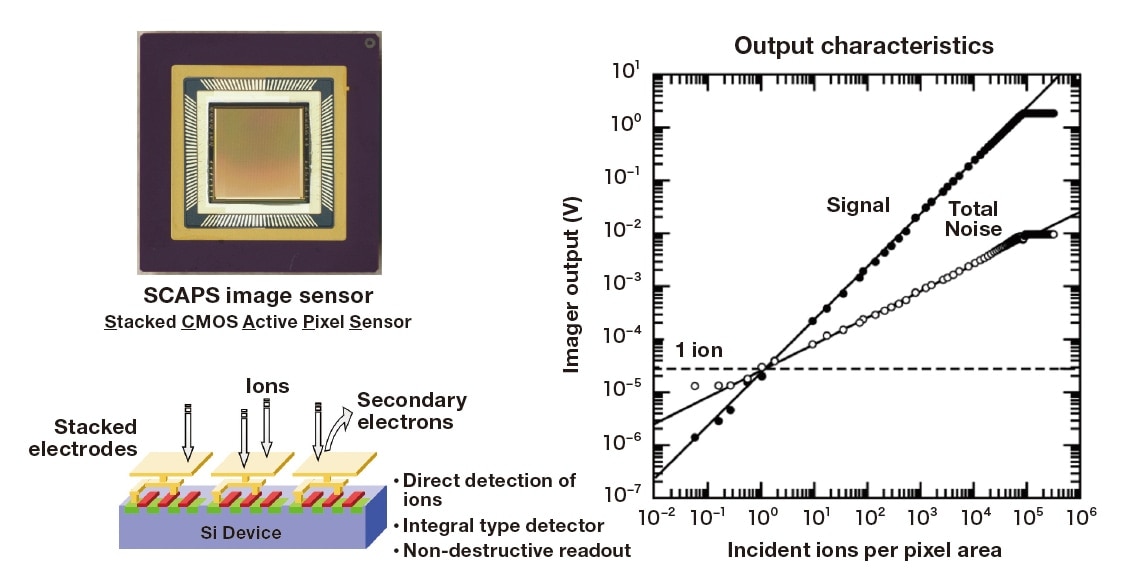
Fig. 2 SCAPS ion detector (left) and plot of pixel output signal vs. incident ion intensity (right)
Figure 3 shows a silicon isotope image obtained by irradiating the sample with a primary ion beam passed through a square aperture. Note that increasing the primary ion-beam intensity by an order of magnitude distorts the Köhler illumination at the aperture, doubling the primary ion beam impinging on the sample, but the spatial resolution with which secondary ions sputtered from the sample are detected remains unchanged. As this example demonstrates, in isotope microscopy there is no need for the tight beam focusing required in scanning-probe systems; the pixels of our detector do not saturate even when receiving strong secondary-ion signals. This allows the use of high-intensity primary-ion beams, enabling highly sensitive imaging of isotope distributions.
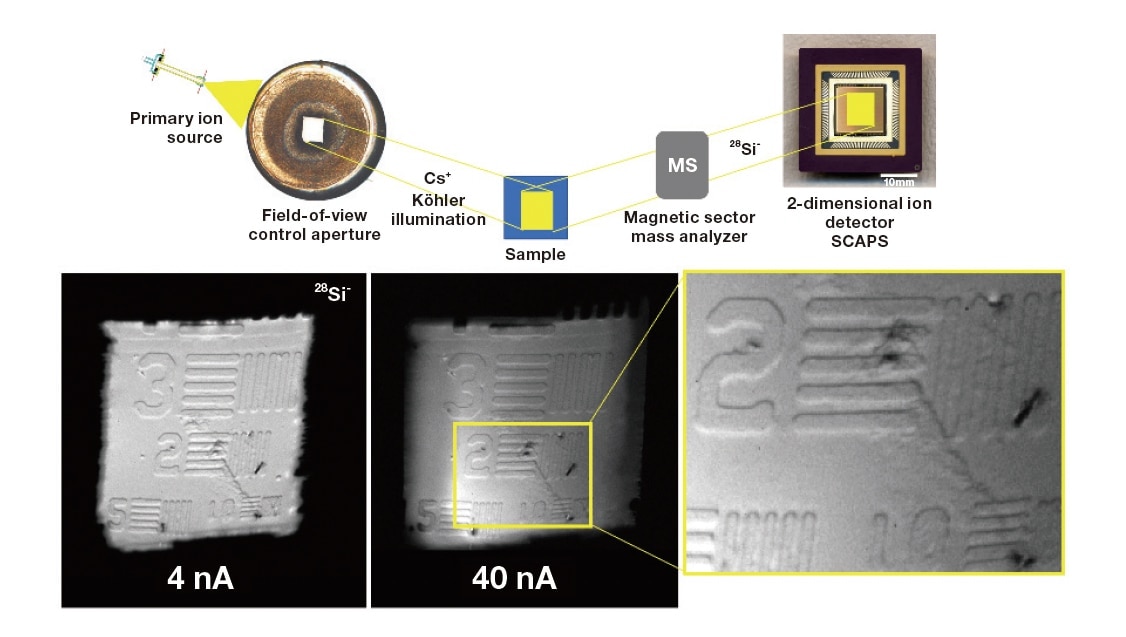
Fig. 3 Schematic depiction of imaging mechanism in isotope microscopy (top) and silicon isotope images obtained for primary-ion beams of various intensities (bottom). Note that our direct-imaging ion optical system ensures that the spatial resolution remains unchanged even for a tenfold increase in probe current. Scale: The linewidth of the numeral-2 feature is 2 μm.
The unique capabilities of isotope microscopy—specifically, its ability to image isotope distributions of arbitrary elements, from hydrogen to uranium, with high sensitivity and high spatial resolution—makes the technique especially powerful for situations in which one has absolutely no idea what elements might be present, with what abundances, or in which regions of samples. In such cases, isotope microscopy often yields valuable hints as to which sample regions may offer fruitful search targets—thus furnishing jumping-off points for atomic-scale analysis via methods such as electron microscopy or atomic-probe techniques. For this reason, isotope microscopy is used not only in space research but also in many other fields of science and engineering—including advanced material science, semiconductor device engineering, biological sciences, and medicine—to identify promising regions and directions for initial forays into new, unexplored domains of research and development.
Our solar system is believed to have been formed through the aggregation of gas and dust clouds produced by explosions of late-stage stars having exhausted their supplies of fuel. The “dust” in this scenario consists of atoms with nuclei produced in nucleosynthesis processes accompanying various combustion reactions in the interior of stars; consequently, the isotopic composition of the dust is highly sensitive to the mass, and the stage of evolution, of the stars in which it was formed. And, as it turns out, this dust—the very raw material from which our solar system is made— may be studied by using isotope microscopy to analyze meteorites9).
As an example, Figure 4 shows oxygen isotope images of a meteorite. To generate these images, a region with a radius of 100 μm on the upper surface of a thin, polished meteorite fragment was irradiated by a beam of primary Cs+ ions (intensity: 2 nA), causing 16O- and 18O- secondary ions to be sputtered from the surface. By switching the strength of a magnetic field we may direct one or the other of these secondary ion species to the SCAPS detector, yielding the projection isotope images shown in the figure. In this case our experimental procedure required approximately 1 hour and yielded 10 images for each of the two isotope species. Afterward, the depth of the sample region removed by sputtering was measured to be approximately 300 nm. Thus our analysis yields 3-dimensional images of the 18O/16O isotope ratio in a cylindrical sample region with dimensions of 100 μm (radius) × 0.3 μm (height), represented by image slices captured at 30-nm intervals in the height direction.
Comparing the images for 16O and 18O, we see that the two isotopes exist in roughly equal proportions throughout most of the sample, but the 18O image contains a number of bright spots (indicated by squares in Figure 4) not seen for 16O. Indeed, the corresponding points in the 16O image are indistinguishable from their surroundings, indicating a relative abundance of 18O at these points compared to what is seen elsewhere. The lower portion of Figure 4 shows enlarged regions of the isotope-ratio image, i.e. the plot of 18O concentration divided by 16O concentration, captured at sample depths ranging from 30 nm (far left) to 210 nm (far right). Starting at 30 nm, the sizes of the 18O-rich brightspot regions increase with increasing sample depth until peaking at a depth of 120 nm, beyond which the bright spots gradually shrink in size, eventually vanishing altogether at 210 nm. We conclude that the size of this grain was approximately 200 nm. According to the theory of nucleosynthesis, oxygen clusters with isotope distributions like that shown here are thought to be formed in supernovas; grains of this sort, whose creation predates the formation of our solar system, are known as presolar grains.
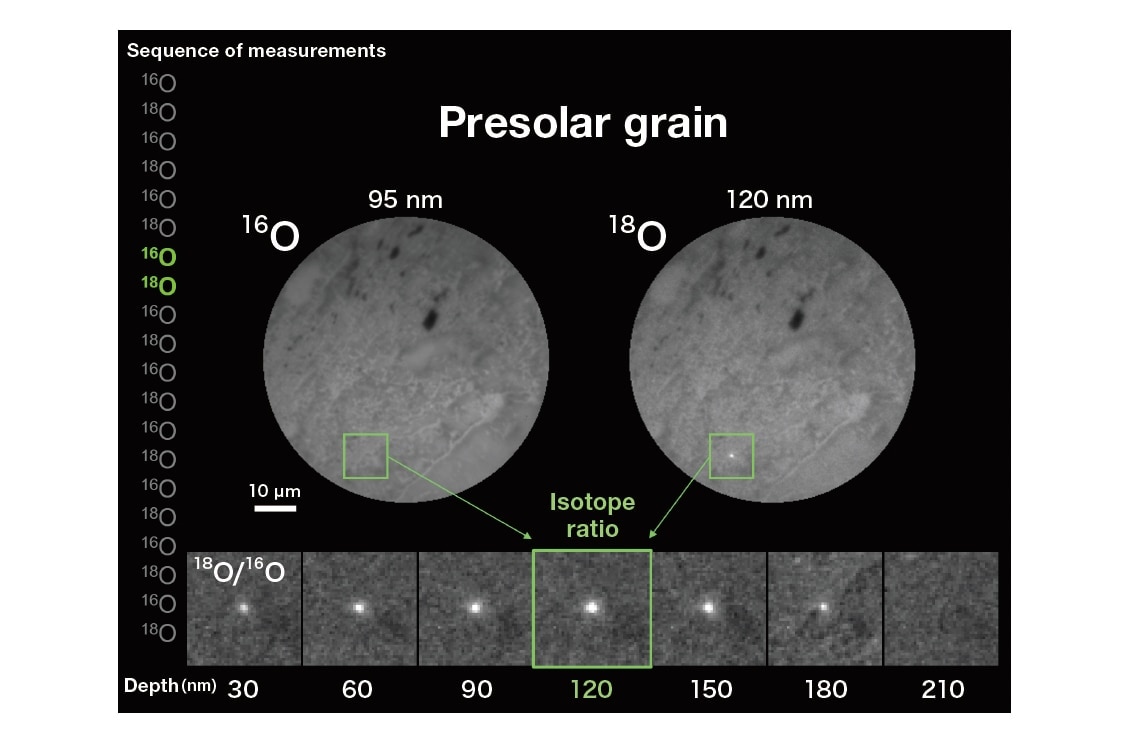
Fig. 4 Three-dimensional isotope-ratio images of a meteorite sample. Squares indicate regions of relative 18O abundance, thought to be formed by supernovas. The size of the grain is 0.2 μm.
If the solar system was formed by the aggregation of presolar grains, then the study of such grains yields direct insight into the raw materials of our solar system. Of course, in view of the minuscule sizes of individual atoms, one should investigate the statistical properties of large ensembles rather than individual grains. Thus, rather than allowing analyses to continue until no grains remain, one should instead detect isotopic irregularities automatically; as soon as such an irregularity is detected in a given region, we terminate the analysis for that region and proceed to analyze the next region. Because our isotope microscope is a direct-imaging system whose spatial resolution is independent of probe intensity, it may be thought of as an extremely efficient instrument for aggregating presolar grains—and a tool capable of automatically searching for the basic building blocks of the solar system.
If presolar grains reflect the isotopic composition of the stars in which they were formed, then what is reflected by regions of uniform isotopic composition, which cover most of the image? Figure 5 shows an oxygen isotope-ratio image obtained while searching for presolar grains in a meteorite known as Acfer 094, found in an a desert in Africa. As in the case of Figure 4, we see regions of uniform isotopic composition, within which are embedded (a) small presolar grains rich in 17O alone, as well as (b) regions with sizes on the order of a few microns that are rich in both 17O and 18O (indicated by arrows). It turns out that this isotope image, and the properties of the substance it reflects, are the key to understanding the origins of the uniform isotopic composition of the solar system10).
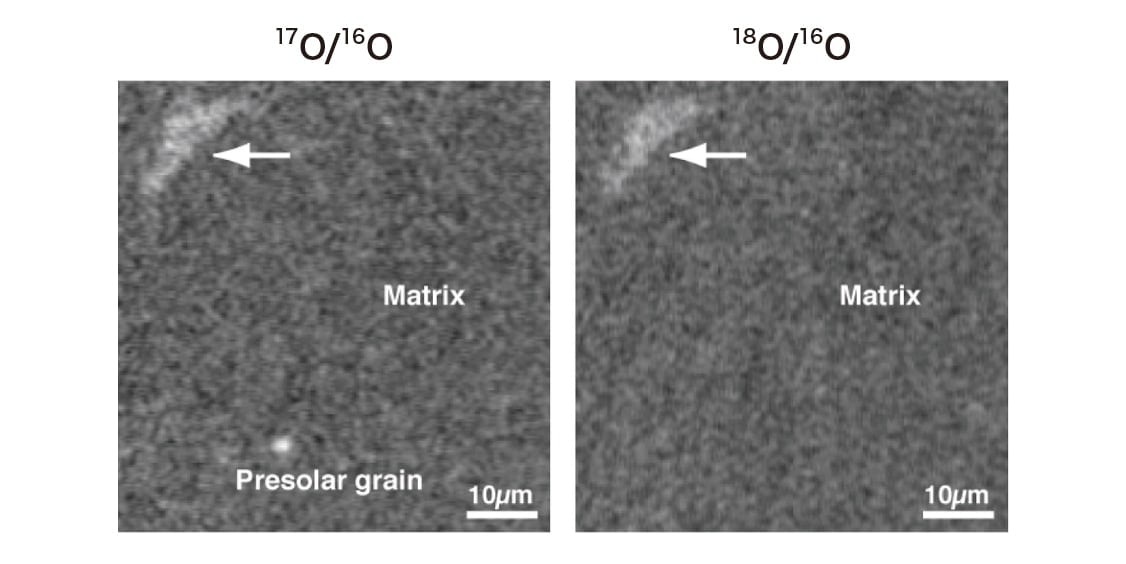
Fig. 5 Oxygen isotope-ratio image of a meteorite sample. The image shows (a) presolar grains, rich in 17O alone, as well as (b) regions rich in both 17O and 18O (arrows); both (a) and (b) are embedded in a surrounding matrix of uniform isotopic composition.
Figure 6 shows oxygen isotope compositions for the primary solar-system materials we have analyzed thus far. There are three stable isotopes of oxygen, with mass numbers of 16, 17, and 18; on Earth these exist with relative abundances of 99.757:0.038:0.205. Although the natural abundances of isotopes span a range of more than four orders of magnitude, the variations in abundances are extremely small. Thus, the vertical and horizontal axes in this plot respectively indicate deviations, in parts per thousand, of the ratios 17O/16O and 18O/16O from their terrestrial values. The origin of the figure corresponds to standard seawater on Earth. If we wish to quantify isotope ratios for isotopes with very different natural abundances, then the ability to capture pretty pictures is of no use whatsoever; instead, we need isotope microscopes capable of acquiring quantitatively sufficient signals.
In contrast to presolar grains—which exhibit widely varying isotopic compositions reflecting the conditions of stellar nucleosynthesis—from Figure 6 we see that, for some reason, the oxygen isotopes of most substances in our solar system fall on a single straight line in this plot. Moreover, this line does not have a slope of 1/2 (the terrestrial fractionation line) as we might expect from the difference in mass; instead, the slope of the line is nearly 1. In Figure 5 we observed regions characterized by equal abundances of 17O and 18O. Adding data points for these regions to Figure 6 yields the blue circles visible near the upper-right corner of the graph; note that these points too fall on the mysterious line with a slope of 1. Electron-microscope observations of this material reveal nanocrystals of magnetite and of iron sulfide, intertwined in a 1:1 configuration to yield a symplectite structure; for this reason, the material is known as cosmic symplectite. Magnetite (Fe3O4) is sometimes known as “black rust” because it is formed when iron (Fe) or iron sulfide (FeS)—two species that originally contain no oxygen—are oxidized by water (H2O), the water responsible for oxidizing cosmic symplectite is thought to be rich in 17,18O11).
In the opposite corner of the graph—the lower left corner, poor in 17,18O—we find a data point which lies slightly off the mysterious line, but is close to the analytical value for the solar wind captured by NASA’s genesis mission12). If the straight line with an approximate slope of 1—obeyed by nearly all substances in the solar system—was determined by combining the sun (which accounts for 99.8% of the mass of the solar system) with the water present in cosmic symplectite, we would conclude that the solar system formed while blending incompletely with primitive liquid water, which is rich in 17,18O13).
When the samples brought home to Earth by Japan’s Hayabusa craft were analyzed via isotope microscopy, the resulting oxygen isotope composition differed only slightly from that of terrestrial substances14). This slight difference in isotopic composition lends evidence to the contention that the substance found in the Hayabusa’s return capsule was not terrestrial matter, but rather a fragment of the asteroid Itokawa—and thus that the Hayabusa succeeded in its mission to acquire samples and return them to Earth. When extraterrestrial materials are actively brought home to Earth by future exploratory missions, the positions of the corresponding data points in the plot of Figure 6 will yield valuable input to shape our understanding of the formation of our solar system.
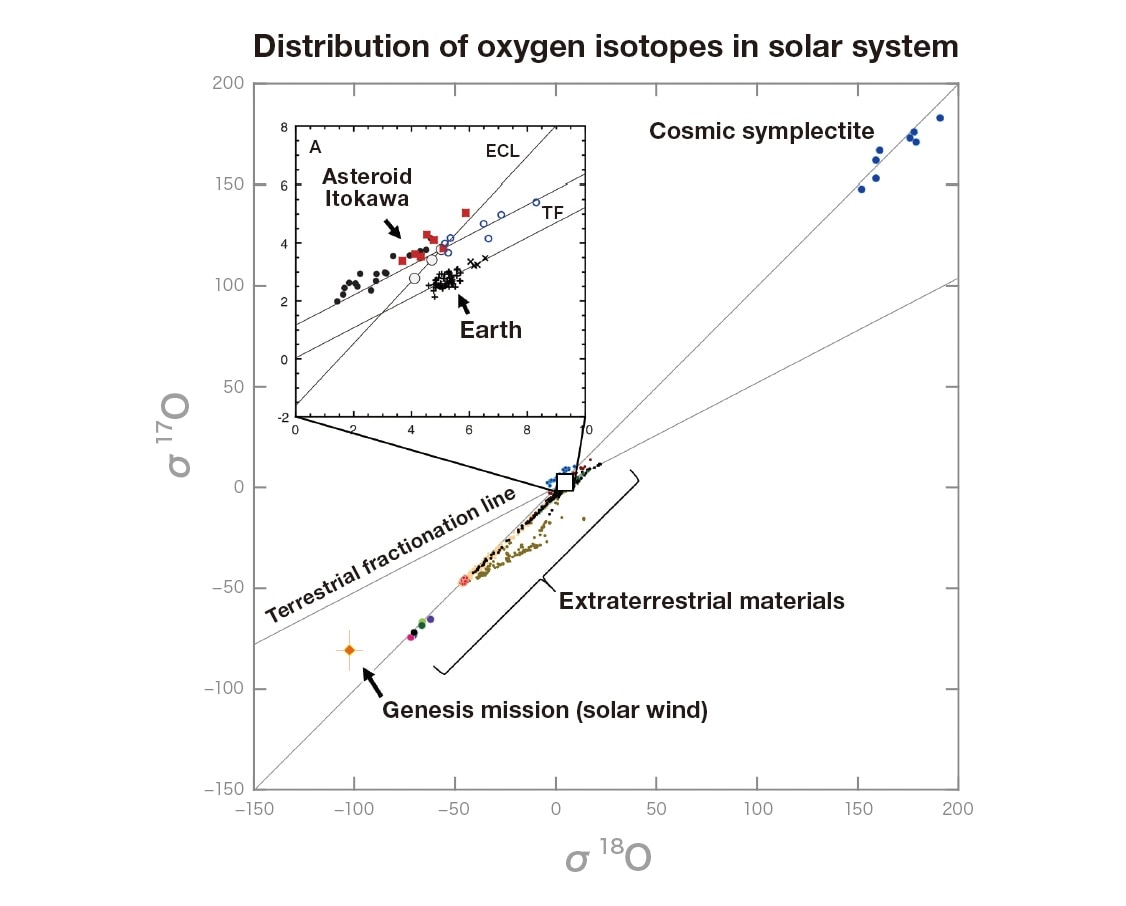
Fig. 6 Distribution of oxygen isotopes in our solar system. The solar system is thought to have formed when the 17,18O-rich matter at the upper right merged with the 17,18O-poor matter at the lower left.
Does water exist on the moon? The Apollo program of the 1960s, which landed a spacecraft on the moon’s surface and collected several tons of lunar samples, concluded that the answer was No. However, in recent years this consensus underwent a 180-degree shift, and today it is generally accepted that water does exist on the moon. Figure 7 shows an isotope-microscope analysis of lunar material brought back to Earth by the Apollo 11 mission; the image clearly indicates the presence of hydrogen15). With large quantities of terrestrially adsorbed water emerging from the various holes and cracks—large and small—in the sample, hydrogen was detected in a mineral known as apatite. Because water is a ubiquitous substance that exists everywhere on Earth, it is found not only in the atmosphere but even in the ultra-high-vacuum environment of the isotope microscope, where trace water content on the order of just a few hundred ppm is more than enough to cause observational errors. In the case of lunar rocks, fortunately the hydrogen isotope ratio of apatite differs significantly from that on Earth, and thus we acquire some reassurance that our analysis was correct. However, meticulous care is required for samples whose isotopic compositions match those found on Earth. By a curious coincidence, immediately after I completed the acquisition of this image, Dr. Greenwood—a research collaborator who was sitting next to me and browsing the Internet—stumbled across the news that NASA had detected water in dust clouds kicked up by the forceful collision of its LCROSS explorer craft with the lunar surface, and remarked out loud on this finding: “Hey, guess what! Looks like there’s water on the moon after all!” I remember
replying simply “I know.”
Having said that, the lunar water we discovered is nothing more than mere crystallization water, and the surface of the moon is still thought to be rather dry. The flip side of this observation is that, with neither water nor air on the moon, one hardly need worry about contamination caused by trace quantities of long-suffering water adsorbed on sample surfaces. If samples could be analyzed on the surface of the moon, future exploratory spacecraft could avoid the dangers of re-entering Earth’s atmosphere and deliver their sample capsules directly to the moon. The search for water in space is the primary imperative for future progress in space; as an initial step to anticipate future initiatives on the moon, installing an isotope microscope on the moon seems an eminently reasonable proposal.
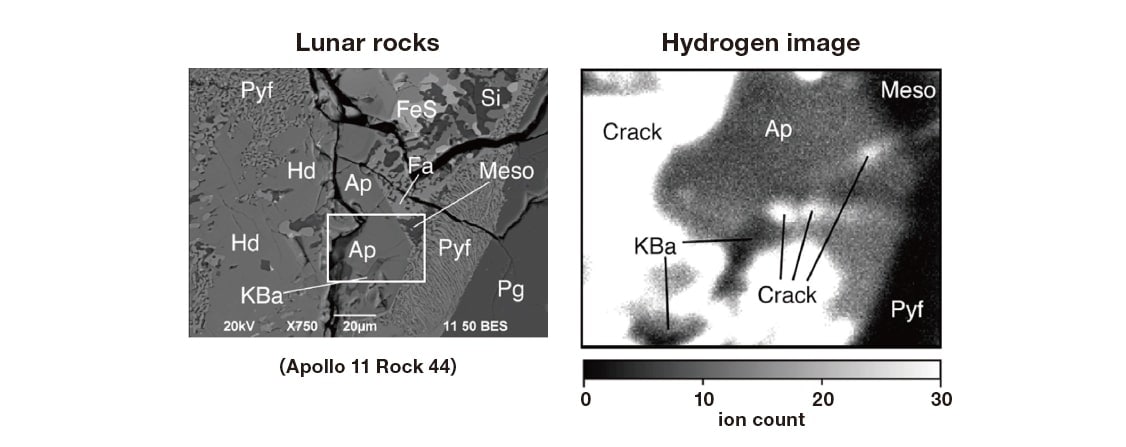
Fig. 7 Left: Electron micrograph of a thin, polished fragment of lunar material brought home to Earth by the Apollo 11 mission. Right: Hydrogen (1H) isotope image of the sample region indicated by the white square in the figure at left. More hydrogen is detected in apatite(Ap) than in the surrounding anhydrous materials (KBa, Meso, Pyf). The hydrogen-rich regions resembling cracks are due to (terrestrial) contamination by surface water adsorption.
In the discipline of logic, one posits a set of axioms and assumptions, proceeds from these to deduce theorems, and identifies the true, correct world as that in which no inconsistencies arise. On the other hand, attempts to deduce foundations for the physical world in which we live have to date been stymied by the extreme paucity of samples available for use in our deductions. Indeed, our sample set at present consists of the Earth’s surface, the meteorites that occasionally fall to it, the smattering of samples retrieved by astronauts from the moon, various miniature comets, tiny fragments of asteroids—and nothing else! Even isotope images, which can suggest such compelling directions in which to search for our origins, would—if laid out side-by-side to form a collage—barely cover the area of a postage stamp. As we rise to meet the challenges of our grand new era of space exploration, it is thrilling to wonder what fascinating new worlds will be discovered—and which longstanding assumptions will be turned on their heads—as we compile enormous repositories of extraplanetary substances and unpack their mysteries through the magic of isotope microscopy.
References
Original paper written in Japanese “The Solar System Explored by Isotope Microscope” has been translated to this English version by Hitachi-High Tech Corporation.
See more
