
Masahiro Kitada
Dr. (Engineering)
Professor Emeritus
Tokyo University of the Arts
Modern human civilization is said to have begun with the use of metal tools. From natural gold, natural silver, and natural copper, an understanding of techniques for refining copper gradually emerged, leading to the development of bronze, an alloy of copper and tin. As the bronze age proceeded, eventually the refinement of iron became possible as well. The refinement process converts iron into carbon-containing steel and cast iron; these are alloys of iron and carbon. Thereafter, there was little progress in alloy development until the 18th century, but—surprisingly— bronze and cast-iron alloys were already being produced at the beginning of the 1st century. This marks an extremely important event in the history of metallurgy. These alloys were used to produce huoquan (貨泉 in Chinese), a type of cast metal coin made during China’s Xin dynasty (8-23 AD). Most huoquan were made from bronze, but some of these coins contain Fe—they are basically Cu-Fe alloys—and are sensitive to permanent magnets. However, the mutual solid solubility of this system is low, and a detailed understanding of its properties was lacking until it began to be studied as an immiscible alloy in the modern era1).
The coins described here primarily contain Cu, Fe, C, Sn, and Pb, but, with the exception of the Cu-Sn system, their two-component alloys are immiscible and extremely complicated. For this reason, they are fascinating objects of study not only as ancient cultural artifacts but also as metallurgical specimens. The Cu-Fe dilute solid solution forming the basis of these specimens is known to exhibit age hardening2), and with the advent of electron microscopy it became clear that each parent phase contained fine-grained coherent precipitates, as well as partially coherent precipitates grown from these3,4). Today, such age hardening of Cu-Fe alloys is sometimes exploited for practical uses5).
In this article, the fine-grained structures of one such ancient coin made from a Cu-Fe alloy with various other ingredients have been observed.
A photograph of the front side of the coin specimen used is shown in Fig.1(a). The front surface is a rust-colored blend of brown and patina hues, and—though not clearly discernible—the Chinese characters 貨 (“huo”) and 泉 (“quan”) are cast respectively on its right and left sides. The sample area subjected to our analysis is indicated by the arrow in image (a), and (b) is an observation of its cross-sectional macrostructure.
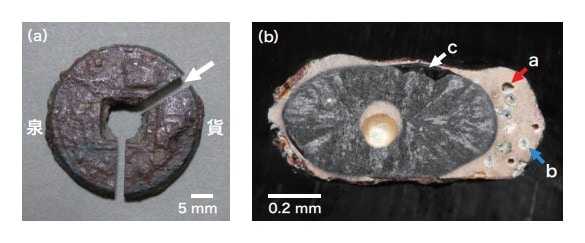
Fig. 1 (a) Photograph of huoquan ancient coin and (b) cross-sectional macrostructure after etching. The Chinese characters 貨 and 泉 are pronounced huo and quan in English, respectively.
A broad classification of the metallic structure in the cross-sectional post-corrosion image in Fig. 1(b) indicates a copper-colored Cu alloy area near the outer edge, inside of which lies a dark gray area in which Fe is the principal component, and finally a Cu alloy containing cavities in the center. Near the front surface of the coin, Fe areas at various locations are observed, with brown rust areas. In the Cu alloy area near the outer edge, a number of cavities are observed, as indicated by arrow a, as well as circular grains (arrow b) which are interpreted as Fe alloys. Arrow c indicates a cavity at an interface between the Fe and copper alloys. The Fe alloy area in the interior contains stripelike features radiating outward from the center, whose width decreases toward the center. These stripes accompany the solidification of cast iron.
Typical optical micrographs after etching are shown in Fig. 2. Fig. 2(a) is an Fe-C alloy; this is white cast iron, comprising bright cementite (Fe3C) and dark structures in which γ-phase (a high-temperature phase consisting of Fe-C solid solutions with face-centered cubic [fcc] structure) areas have transformed into pearlite (α-Fe with needle-shaped Fe3C) phases. In cast iron containing large quantities of carbon and silicon impurities, carbon crystallizes in the form of graphite. As exposed surfaces of this material are gray in color, it is called gray cast iron. If silicon is not abundant, the material tends to crystallize in a cementite structure with exposed surfaces appearing metallic white in color; this is called white cast iron. The fact that pearlite areas appear dark in the figure is due to etching; freshly exposed surfaces appear white in color. The term “pearlite” is derived from the word “pearl” because pearlite is a lustrous pearl-like mineral. Pearlite in Fe-C alloys is said to have been named for the pearl-like luster of its exposed surfaces.
On the other hand, the structure in Fig. 2(b) is the common Cu alloy known as bronze; the matrix is a Cu-Sn solid solution (α-Cu), the brightest grains indicated by arrow δ are Cu4Sn (δ phase), and the large dark grains indicated by arrow Pb are Pb. The average composition (mass%) of the Cu alloy, as measured by energy-dispersive X-ray spectroscopy, is Cu-10.2% Sn-6.0% Pb-1.4% Fe. Neglecting Fe, α-Cu is the material known as tin bronze, commonly used in ancient times. Analysis of the δ phase yields a composition of Cu-19.8 mol% Sn, with a Cu/Sn atom ratio of 4.05. Corrosion in the α-Cu region is nonuniform; light and dark areas and segregation of other components are observed.
In passing, the Japanese word for bronze, seidou, literally means “blue copper”, a fact for which two distinct explanations are commonly offered: (1) adding high concentrations of Sn to Cu yields a substance with a blue-white metallic luster (δ phase), or (2) corrosion causes rust, yielding a greenish-blue color. Of these, explanation (1) is correct. Incidentally, the addition of approximately 20% Ag to Au yields a substance known as “green gold’’ while Al is sometimes referred to as a “bluish metal.”

Fig. 2 Optical micrographs of (a) typical cast-iron and (b) bronze areas of specimen.
Elemental maps of the area in Fig. 2(b) are shown in Fig. 3. Copper is distributed roughly uniformly through the matrix, with dark areas containing δ-phase and Pb grains. The distribution of Sn is non-uniform, with segregation visible; this is in agreement with the post-etching image in Fig. 2(b). In the Fe map, Fe-rich areas with sizes of a few microns are visible here and there. As described above, this Cu alloy is a Cu-Sn-Pb-Fe-C system, but the only subsystem with high solid solubility is the Cu-Sn system (with the solid solubility of Sn being approximately 14 mass%); the remaining subsystems have extremely low solid solubilities6). The solidification temperature of Pb is significantly lower than that of α-Cu, so large Pb grains solidify after being preserved down to low temperatures. In large Pb grains, Cu is detected at a concentration of approximately 4.5 mass%; as described below, Cu grains exist inside Pb grains.
The specimen contains essentially two distinct metallic structures, with the quasi-two-component alloy systems Fe-C (white cast iron) and Cu-Sn (tin bronze). For the Cu-Fe system forming the basis of these systems, previous studies have reported a two-liquid phase that segregates due to gravity, with Fe—the higher fusion-point element— condensing to yield initial crystals, allowing isolation of Cu; it has also been reported that Fe floats on Cu. Thus, it is difficult to form uniform alloys from this system7). Alloys containing abundant quantities of uniformly condensed Cu take the form of a Cu matrix with Fe dendrites1). The specimen in this study is not a Cu-Fe system, but rather a system of tin-bronze (α-Cu) and white cast iron. The system passes through a solidification process in which its composition is close to that of the Cu-Fe3C system in a quasi-3-component Cu-Fe-Fe3C system; however, the quasi-2-component CuFe3C system is said to become a two-liquid phase at high temperatures8), and in the specimen the areas of white cast iron—the higher melting point system—pushes Cu alloys toward the outer edge of the coin, solidifying in the interior.
The stripes evident in white cast-iron area begin near the outer perimeter of the cross-sectional surface and extend inward toward the center, narrowing as they do so in a reverse-radiative pattern. The direction of decreasing stripe width is the direction of growth accompanying decreasing cast-iron temperature; the cast iron follows these stripes to solidify toward the center of the coin, expelling Cu in the process.
Iron rust is present in portions of the outer perimeter of the coin, so some of the white cast iron is present in the vicinity of its front surface; before rusting, it would have looked like a bronze coin. The use of inexpensive raw materials to produce cast-iron coins is said to have begun during the Northern Song (960-1127) or XiXia (1038-1227) eras for the purposes of creating supplementary coins or saving bronze9). The coin may also have been designed to save high-cost bronze or to create the appearance of an increase in quantity.
The Vickers hardness of the white cast-iron area of the specimen was 679, while that for Cu-alloy area was 112 (for a 0.3 kg load). White cast iron has a Vickers hardness of 500-60010), and so the hardness values are somewhat high, which is due to precipitation hardening by Cu in α-Fe. The hardness of annealed Cu-10 mass% Sn alloys is approximately 11011), in agreement with the hardness value obtained for Cu alloy areas.

Fig. 3 Elemental maps of the area in Fig. 2(b).
A typical scanning electron micrograph (SEM) and energy-dispersive X-ray spectroscopy pattern for a white castiron area are shown in Fig. 4. The structure at point A in the micrograph is cementite, while the dark layered structure at point B is pearlite transformed from γ-Fe, consisting of α-Fe with needle-shaped cementite (Fe3C). In the energydispersive X-ray spectroscopy pattern for the cementite area at point A, Fe and C, the principal components of white cast iron, are detected. In contrast, for the pearlite area at point B, not only Fe and C but also Cu are detected. The Cu concentration varies depending on the specific pearlite area analyzed, but its mean value is around 4.5 mass%. In the phase diagram for the Fe-Cu system12), the maximum solid solubility for Cu with respect to Fe is approximately 8.5 mass% for γ-Fe (1094°C) and 1.4-3.0 mass% for α-Fe (800-850°C) 13,14), but the room-temperature solubilities are very low, and precise solubility limits are unclear. The presence of Cu in the pearlite is due to solid-solution Cu, present within the γ-Fe that crystallized at high temperature before the phase transformation, remaining in the α-Fe. Both γ-Fe and Cu crystallize in the fcc structure, so Cu is highly soluble in the γ phase; however, Cu does not form a solid solution in the cementite that prevails after phase transformation, but rather segregates within α-Fe. For both cast copper and cast iron, the addition of trace amounts of Cu has been reported to increase the hardness of α-Fe15); this is due to precipitation hardening by small Cu grains.
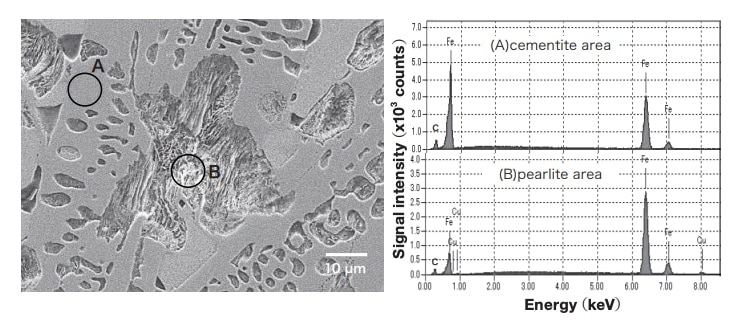
Fig. 4 SEM image and energy-dispersive X-ray spectroscopy pattern for white cast-iron area.
A transmission electron microscopy (TEM) image of a pearlite area is shown in Fig. 5 together with an energydispersive X-ray spectroscopy pattern for cementite (A) and α-Fe (B) at the points indicated in the micrograph. In the α-Fe area, small grains are observed. For the cementite, in addition to Fe and C, Si is detected. For the α-Fe, Cu and trace quantities of Si are detected. Si is an impurity found in iron minerals. The analysis finds a Cu concentration of around 3 mass% in α-Fe; because of the extremely low solubility, this precipitates in the form of grains. The small copper grains of 10-30 nm are observed in Fig. 6(a), and form an ordered array, but no contrast due to distortion in the vicinity of the small grains is observed. There is no crystal-lattice coherence between body-centered cubic (bcc) α-Fe and fcc Cu, so the small grains are fcc Cu. Slightly larger Cu grains are observed in the vicinity of cementite, and small grains precipitate preferentially on the cementite surface. In the Cu map in Fig. 6(b), Cu precipitates are observed throughout the whole area, and the Cu distribution matches the images of grains appearing to have segregated near cementite. The insets in Fig. 6(a) show electron diffraction patterns for the α-Fe and cementite areas. The clear spots for the α-Fe region are due to α-Fe; spots of lesser clarity due to diffraction by Cu grains are also detected. Fine Cu grains in α-Fe result from Cu atoms originally present in α-Fe that remain after the transition from γ-Fe and precipitate due to the low solid solubility of Cu in that phase. When Fe-Cu alloys containing a few mass% of Cu are subjected to isothermal aging above 500-550°C, the emergence of bcc Cu crystals is first observed, accompanied by coherent distortion contrast16,17). If the aging proceeds for a long time, these change to fcc Cu crystals, and distortion-contrast patterns near grains are no longer observed. The specimen in this study was formed by casting, so precipitation occurred during cooling, but the non-observation of distortion contrast near small grains indicates that Cu grains are fcc structured.
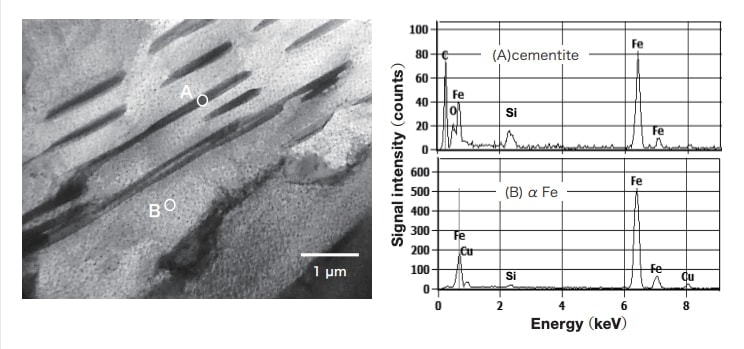
Fig. 5 TEM image and energy-dispersive X-ray patterns for pearlite area in white cast iron.
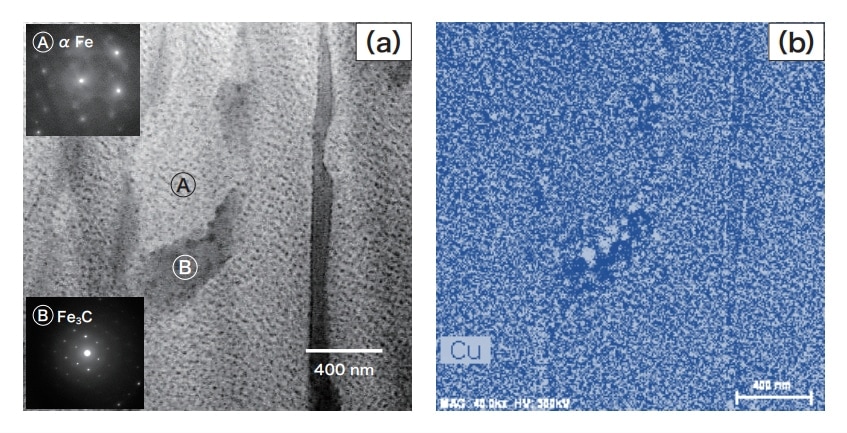
Fig. 6 (a) TEM image of pearlite area and (b) Cu map. Electron-diffraction patterns for areas Ⓐ and Ⓑ are superimposed in (a).
In the TEM image of a bronze (α-Cu) area shown in Fig. 7, small particulate contrast areas inside the α-Cu crystals at the left and right are observed. The fact that no contrast is seen in the center crystal is due to the diffraction conditions. This contrast arises due to the distortion of small crystals coherent with the matrix. Relatively large precipitates, indicated by the arrow, similar to the Fe grains observed in the Fe map in Fig. 3, are observed. A high-angle annular dark-field (HAADF) image, and Cu and Fe maps for an area in which precipitates exist are shown in Fig. 8. Fine grains with sizes of 50-80 nm are observed; these areas are Cu-poor and Fe-rich. Thus, the fine grains are Fe. Areas with distortion contrast are present in the vicinity of Fe grains, and dislocations are also observed in configurations intertwined with Fe grains.
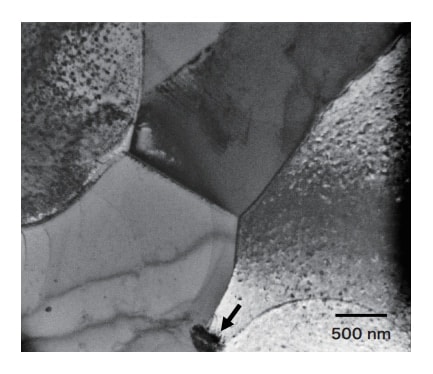
Fig. 7 TEM image of α-Cu.
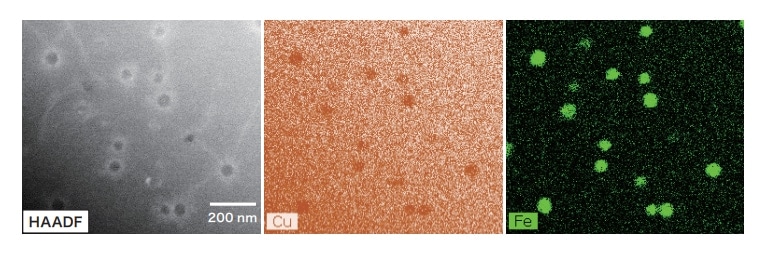
Fig. 8 HAADF image of αCu, and Cu and Fe maps.
In the high-magnification TEM image of α-Cu shown in Fig. 9(a), parallel stripes inside fine grains, with distortion contrast present nearby, are observed. This is the origin of the contrast described above in the discussion of Fig. 7. Stripes within grains have identical orientations, indicating that a particular crystallographic relationship exists between precipitates and the α-Cu matrix. From the high-magnification image of Fig. 9(b), Fe grains are hexagonal, and the distortion contrast surrounding them is symmetric. Crystal-lattice coherence exists between the Fe crystal and the α-Cu matrix, and this Fe exists in the fcc structure. This coherence has been reported to be reduced to only partial coherence when the Fe grain size exceeds 60 nm4). The parallel stripes inside grains may represent Fe crystal twinning, but in the crystal-lattice image of the grain interior shown in Fig. 9(c), the characteristic lattice symmetry expected for twinned crystals is not observed; instead multiple crystal lattices are present. Thus the stripes observed within grains are Moire interference patterns arising from the Fe and Cu crystal lattices. Similar fcc-structured Fe crystals within Cu have been observed in Cu-Fe alloys subjected to isothermal aging3,4,18).
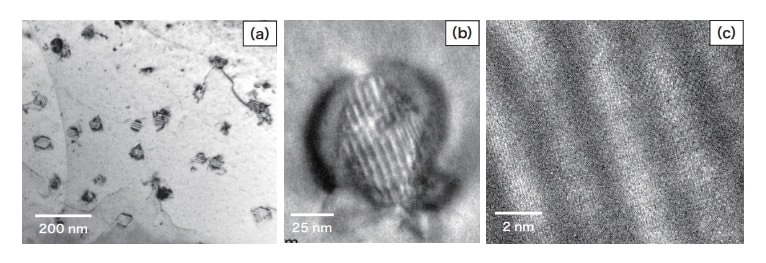
Fig. 9 TEM images of Fe precipitates in α-Cu.
Spherical fcc Fe crystals, with sizes smaller than those observed here and exhibiting mirror-symmetric patterns of distortion contrast, have also been observed3,4,19). Fig. 10 is a TEM image of an area of the specimen in which mirrorsymmetric distortion contrast and relatively large Fe grains coexist. It is considered that the mirror-symmetric contrast is associated with spherical fcc Fe. On the other hand, it is thought that large Fe grains coexisting with spherical fcc Fe did not precipitate simultaneously, but rather separated at early stages of the solidification process. In the vicinity of large Fe grains, the emergence of dislocations intertwined with the grains is observed. The thermal expansion coefficients for α-Cu and Fe differ, causing distortion during cooling and giving rise of dislocations emanating from the vicinity of material boundaries to relax this distortion.
α-Cu is a Cu-Sn solid solution, from which Fe present in the solid-solution phase precipitates as in the Cu-Fe system. Previous studies have observed precipitation of small Fe grains due to isothermal aging, but the phenomenon observed in this specimen occurs during cooling following solidification from the melt. For this reason, the alloy composition and local cooling conditions vary from point to point in the body—something that is not true under isothermal conditions— and thus multiple distinct precipitation phenomena occur roughly simultaneously in distinct specimen areas.
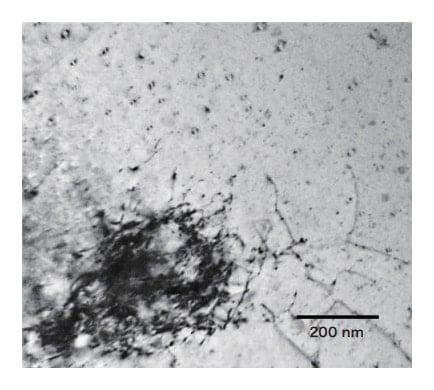
Fig. 10 Fine Fe grains in α-Cu with mirror-symmetric contrast and large Fe grains accompanied by dislocations.
As seen in Fig. 2(b), relatively coarse Pb grains exist in α-Cu. Separate from this, fine grains with sizes of 10-50 nm—with contrast patterns different from those for Fe grains (Fig. 8)— exist in α-Cu areas far from Pb grains, as seen in the HAADF image in Fig. 11(a). These consist of Pb, as is clear from the elemental map in Fig. 11(b), and as is further confirmed by analysis of Fig. 11(c), a crystal-lattice image of fine Pb grains. Fine Fe grains are not observed in areas where fine Pb grains are present. The fact that Pb and Fe grains exist in different areas of α-Cu is due to the low solid solubility of Pb and Fe in Cu, preventing coexistence of these elements. As noted above, Cu and Pb form an immiscible alloy, and the melting point of Pb is 327.4°C, the lowest among the metals contained in the coin specimen. Under ordinary conditions Pb is a liquid up to this point. Most of the Pb expelled from α-Cu condenses to form relatively large grains, but Pb atoms existing here and there in α-Cu under oversaturated conditions are assumed to precipitate in the form of fine grains.
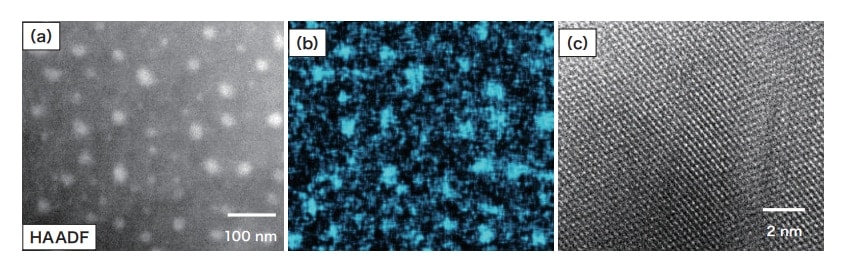
Fig. 11 Pb grains in α-Cu: (a) HAADF image, (b) Pb map, and (c) crystal-lattice image of Pb grains.
As noted above, Cu exists inside large Pb grains in α-Cu. A dark-field scanning TEM image and Pb and Cu maps of the vicinity of the interface between a large Pb grain and α-Cu are shown in Fig. 12. In the Pb grain (left-most image) dispersed small polygonal grains with sizes of 100-200 nm appear; in the Pb and Cu maps, the polygonal grains inside Pb are Cu. The phase diagram for the Pb-Cu system20) indicates that, in the temperature range 327-954°C, Pb is a liquid while Cu is a solid. Below the liquidus on the Pb side, Cu begins to precipitate in crystalline form. Thus, Cu crystals are precipitated from the Pb-Cu liquid phase. The Cu grains are idiomorphic, growing freely within Pb liquid phases.
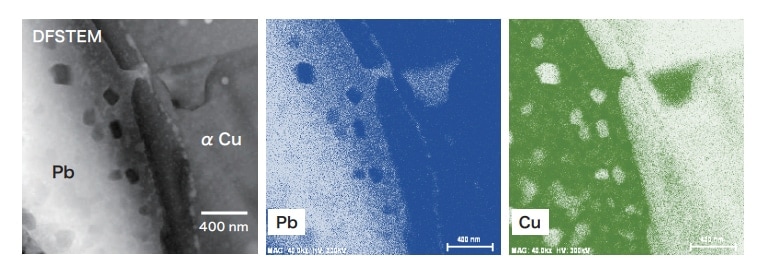
Fig. 12 Dark-field scanning TEM (DFSTEM) image of large Pb grains, and Pb and Cu maps.
A TEM image of the δ phase (Cu4Sn) and energy-dispersive X-ray spectroscopy patterns for the two areas indicated in the image are shown in Fig. 13. The inset in the TEM image is an electron-diffraction pattern for area A. The δ-phase matrix contains fine grains with sizes of 10-20 nm, as well as larger circular grains with sizes of 50-100 nm, indicated by arrow B. The points scattered in ring-shaped configurations in the electron-diffraction pattern of area A are due to fine Pb grains. The composition in area A is: for Cu, 28.2 mass% (19.0 mol%) Pb; for Sn, 10.7 mass% (4.1 mol%) Pb. The matrix exists in the δ-phase (Cu4Sn), and the Pb concentration is due to fine Pb precipitates in the δ phase. Distortion-contrast patterns indicating coherence with the matrix are not observed in the vicinity of Pb grains. Also, fine grains are present near large Pb grains. In general, when fine grains grow into large grains, they absorb other small grains located nearby, so no small grains are observed near large grains. Therefore, they precipitated under different conditions, with large grains precipitating first.
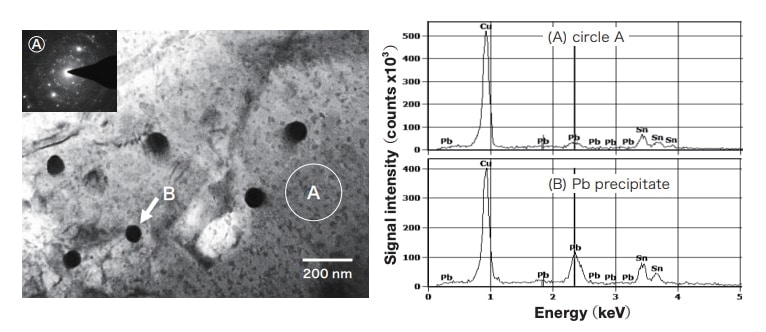
Fig. 13 TEM image of the δ phase (Cu4Sn) and energy-dispersive X-ray spectroscopy pattern for area A and dark grain B in the image. The inset in the TEM image is an electron-diffraction pattern for region A.
In this work, an ancient coin made early in the 1st century, composed primarily of Cu-Fe has been investigated. Tin bronze near the outer edge and the center of the coin is found, while in the interior white cast iron is observed. Cu grains are dispersed throughout the α-Fe white cast-iron. The tin-bronze contains Cu4Sn (δ phase), large Pb precipitates, and Fe grains. Fine Fe precipitates and Pb grains are also observed in α-Cu. Fine polygonal Cu grains are present within large Pb grains, and Pb grains are present in the δ phase. As mentioned above, this ancient coin exhibits an extremely complicated fine-grained structure. Although the composition, thermal-treatment processes, and many other properties of ancient cultural artifacts remain murky, and although the specimen analyzed in this work involved a non-solid-solution multicomponent alloy and exhibited many mysterious features due to its low-temperature phase transformation, this cultural artifact nonetheless represents an extremely important milestone in the history of metallurgy.
In closing, we wish to extend our deepest gratitude to Dr. Kiyohide Saito for providing the specimen and to Ms. Mari Sakagami and Dr. Heishichiro Takahashi for assistance with electron-microscopy observations.
References
