
Yasuhiro Tsuji
PhD
Professor
Laboratory of Clinical Pharmacometrics,
School of Pharmacy, Nihon University
Doctors have always recognized that every patient is unique, and doctors have always tried to tailor their treatments as best they can to individuals. You can match a blood transfusion to a blood type - that was an important discovery. What if matching a cancer cure to our genetic code was just as easy, just as standard? What if figuring out the right dose of medicine was as simple as taking our temperature? - President Obama, January 30, 20151)
Former US President Obama announced the launch of the Precision Medicine Initiative in his January 2015 State of the Union Address. The goal was to accelerate medicine to promote a near-term transformation from a one-size-fits-all to a precision-medicine approach. Until now, medical treatment designed for the “average” patient has been uniformly provided to all. This conventional way of providing treatment often produces an excellent response in some groups of patients but not in others. Precision medicine represents a new approach to medicine in which practitioners predict the therapeutic response in individual patients from a range of individual data, including laboratory test values, genetics, lifestyle, and biomarkers, and use their findings to seek and provide optimal care. The data that practitioners use, however, are not true values but rather values measured or determined using some “yardstick” and therefore contain variability (i.e., error). This also holds true for values predicted in simulations. This variability thus must be factored in to decision-making when applying data to individualized treatment.
This paper, using the keyword of variability (error), is designed to help readers deepen their fundamental understanding of the nature of measured and predicted drug concentrations needed for providing drug therapy for individual patients.
The efficacy of a drug is determined by two factors: pharmacokinetics and pharmacological action. The term pharmacokinetics refers to the series of processes a drug undergoes from the time it enters the body to when it is eliminated. Pharmacological action relates to how and where in the body a drug acts. Thus, to achieve the desired therapeutic effect, a drug that provides the targeted pharmacological effect must be present in the right tissues at the right level. Generally, the level of a drug in the body is proportional to its effect. Expressing the action of a drug in the body as a mathematical formula would show the dose and frequency at which that drug would have to be given for individual patients. Even with all the progress made in the life sciences, however, the “true” level of a drug present in the body at a given time after administration cannot be directly determined. Two workarounds are available.
One problem plagues each of these workarounds. That problem is variability (error). Measured drug concentration values contain many kinds of error, including error attributable to the sampler, sample storage conditions, analytical equipment, and analyst. To ensure that measurements have precision, a validation is performed, with the minimum concentration measurable with precision set as the lower limit of quantification. Data handled in clinical settings contain many kinds of error, including error attributable to the dosing time and time of blood collection and error involving incorporation of data into the history of analysis. To be able to consider these types of variability (error), pharmacokinetic parameters and mathematical models consisting of population means, inter- and intra-individual variation, and covariates are used to produce visual information.
A reference material is a substance used for the calibration of a concentration meter or other analytical instrument or chemical analyzer, or the validation of an analytical procedure. Reference materials are primary standards essential for improving precision and reliability. A material of a given lot number that is made to have uniform parameters is considered a reference material. With the advance of globalization, growing emphasis is being placed on ensuring worldwide reliability of measurements and the results of analyses. Recently, reference materials that are characterized by a metrologically valid procedure for one or more specified properties that are each accompanied by a certificate providing the value of the specified property, its associated uncertainty, and a statement of metrological traceability have been established as certified reference materials2). Reference materials with a detailed statement as to how parameters relevant to reference materials (e.g., assay, purity, homogeneity, stability) were measured3), that is, those that are pedigreed, are certified reference materials. Reconsidering the certainty of laboratory reagents and solvents (e.g., purity) helps reduce material variability (error) (Figure 1).
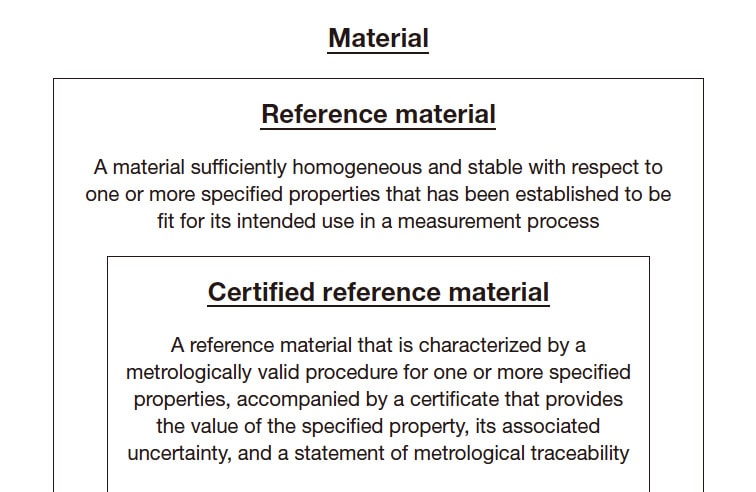
Fig. 1 Reference materials and certified reference materials Adapted by author from Reference 2.
Measured drug concentration values contain many kinds of variability (error), including error attributable to the sampler, sample storage conditions, analytical equipment, and analyst. An easy-to-understand example of how variability arises in measurements and assays is as follows. In an experiment, 1,000 μL of ultrapure water was measured with a pipette and the mass was determined with a precision balance. Analyst A and Analyst B performed this procedure 3 times each. Although this simple procedure involves only pipetting, the variability (error) in the measured values seen in Table 1 occurred. The error caused by one analyst is attributable to pipetting error and error associated with the precision balance, and inter-analyst variability also occurred. Actual drug blood concentration analysis is a multi-step process that includes blood collection, separation of the serum or plasma, storage of the samples until analysis, and analysis with analytical equipment, which means that measured values will contain greater error than the error shown in this example.
Drug concentration analyses can be classified as immunological assays and separation techniques. Immunological assays determine concentrations using antibodies for the drug in question. Drug-specific antibodies are labeled, and the reaction resulting when those antibodies recognize the drug is quantified to determine the drug concentration. For example, an antibody can be labeled with a substance that fluoresces when the antibody recognizes the drug, with the level of absorbance measured. This process is advantageously convenient, quick, and, for some drugs, automatable and therefore widely used to determine drug concentrations in many hospitals. The antibodies, however, may recognize substances other than that targeted substance. Confirmation that they are sufficiently specific and selective is therefore desired. Separation techniques, in contrast, use the chemical and physical properties of the ingredients being analyzed to separate and measure them. High-performance liquid chromatography (HPLC) and liquid chromatography tandem mass spectrometry (LC-MS/MS) are two examples of this class of techniques. As many different substances can be determined by adjusting the combination of solid and mobile phases and pretreatment techniques, these techniques feature a wide range of applicability. The equipment, however, is expensive to acquire, maintain, and operate, and analytical knowledge and skill are required to perform analyses. Major equipment, detection methods, and quantification methods used in HPLC analyses are summarized in Table 24,5).
Newly established measurement and assay procedures should be validated. Validation is performed to evaluate the validity and stability of selectivity, the lower limit of quantification, calibration curve, accuracy, precision, matrix effects, carryover, and dilution3). Accuracy and precision are outlined here. Accuracy refers to how close measured values are to true values. Systems with good accuracy produce measured values near true values, whereas systems with poor accuracy produce measured values divergent from true values that can result in misjudgment of concentrations. Precision refers to the degree of variability (error) among measurements. For a given sample, systems with good precision repeatedly produce comparable measurements, whereas the measurements of systems with poor precision have large variability (error), meaning that reproducibility is poor. Measured values are thus reliable only when the system has both good accuracy and precision (Table 3).
Table 1 Experiment comparing masses of pipetted ultrapure water (mg)
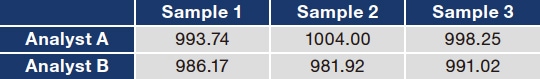
Table 2 Analytical procedures used in high-performance liquid chromatography
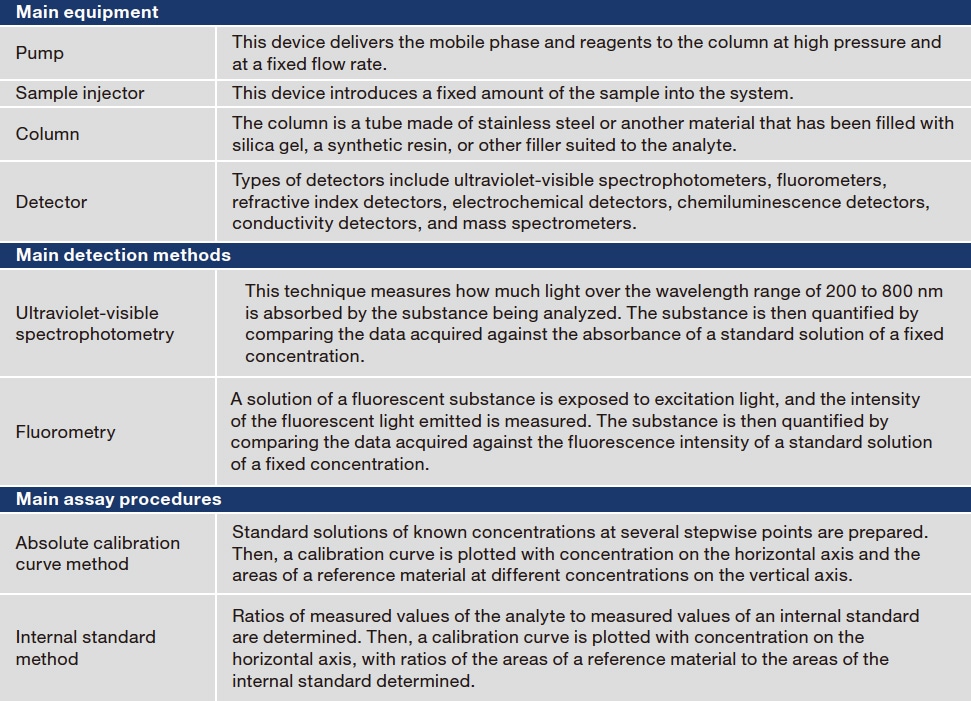
Table 3 Evaluation of accuracy and precision
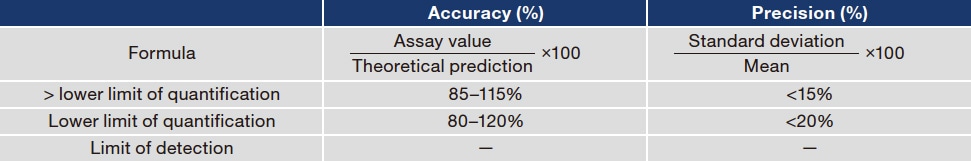
The lower limit of quantification is the limit at which the reliability of assay values is guaranteed.
The limit of detection is the limit at which the substance is detectable as a measured value.
To gain an appreciation of pharmacokinetics in patients who have been treated with a drug, it helps to know how much of the drug is present at what volume in which tissues and organs at different times. I have therefore replaced the word pharmacokinetics with the indicator “drug concentration.” In essence, pharmacokinetics focuses on how to predict drug concentrations in the body at any given time. In practice, pharmacokinetics is based on mathematical models that use ordinary differential equations, which will not be covered here, because a discussion would require a long series of terms and formulas difficult for all but experts to understand.
A drug taken into the body is absorbed by the digestive tract, taken into the circulation, and distributed throughout the body. When some of that drug is metabolized by other substances, it is excreted from the body in the feces or urine. After administration, drug concentrations in the body increase gradually until they peak and then fall. Often, blood is sampled just before the patient takes the next dose and used to determine the drug concentration. The results of drug concentration analysis are then used to rethink the drug dose and dosing interval for the individual patient. The data for pharmacokinetic analyses handled in clinical settings contain many kinds of error, including error attributable to the time of blood collection, drug concentration and test value error, and error attributable to the dosing time6). As shown in Figure 2, blood concentrations of an administered drug change over a large range. Accordingly, analysts should determine whether the specified blood sampling times and methods, measurement methods, and dosing times have been followed before comparing blood drug concentrations.
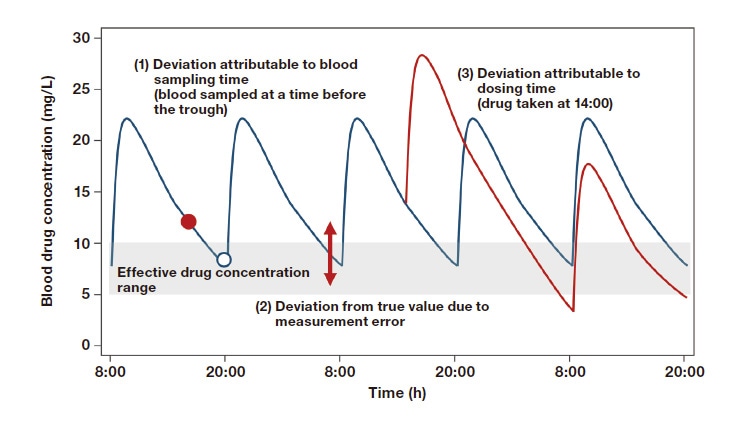
Fig. 2 Variability (error) in drug concentration time courses
Adapted by author from Reference 6.
Although it would be ideal to know the entire series of movements of a drug in the body, the current limits of possibilities in the life sciences allow but a fragmented picture of concentrations in the blood and tissues. For this reason, information about how much variability (error) measured and predicted values contain and how reliable (or unreliable) values are must be evaluated to effectively and properly personalize drug care based on these fragmented data.
References
See more
