
Takashi Ohtsuki
Ph.D. (Pharmacology)
Associate Professor
College of Bioresource Sciences, Nihon University
Quantitative analysis using chromatography, particularly high-performance liquid chromatography (HPLC), features excellent resolution and a wide range of detection techniques that, when combined, make it an indispensable tool that supports development in diverse fields, including pharmaceutical development, food safety, environmental monitoring, and materials assessment1-4). The recent development of higher-sensitivity detectors and diverse carriers to increase the resolution and allow the automatic setup of analytical conditions has enabled the analysis of different substances present in trace amounts in complex matrices, greatly benefiting R&D and quality control efforts.
The speed of progress in HPLC is staggering. Advances in column technologies, including smaller particle sizes, core-shell packing materials, and stationary phases with diverse chemical modifications, have greatly increased the resolution and selectivity5-7). The advent of ultra-performance liquid chromatography has reduced analysis times and increased resolution compared with HPLC8). The practical applications of two-dimensional liquid chromatography have substantially increased the resolution of different substances in complex mixtures9). Even with these advances, however, the responses of detectors used in HPLC still differ widely according to the chemical structure of the analyte in question. The molar absorption coefficients i n U V/visible detectors and multi-wavelength detectors, for example, differ depending on the structure of the chromophore. These structural factors include the extent of the conjugate system within the molecules of the analyte, the type and number of chromophores, and the electron-donating or electron-withdrawing nature of substituents10). The ionization efficiency of mass-spectrometry detectors varies significantly across different analytes11). The detection sensitivity of fluorescence detectors, moreover, is directly influenced by differences in the fluorescence quantum yields for chromophores12). To accurately determine an analyte, therefore, a reliably pure assay-grade standard identical to that analyte is needed. There are, however, very few certified reference materials (CRMs) whose purity is characterized by a metrologically valid procedure whose associated uncertainty is clear13-14). CRMs are developed and supplied by international and national organizations for analytical standardization, but the development process is complex and time consuming15). Characterizing a reference material requires valuation using a primary method of measurement and verification of equivalence through international comparison. Although needed for ensuring the reliability of reference materials, these strict procedures also increase development costs and delay availability16). CRM development is particularly lagging for naturally derived substances with complex chemical structures17). For this reason, reagents made by chemical manufacturers are normally used as assay-grade standards for HPLC analysis. Although the purity of most such reagents is established according to the specifications of the manufacturer, metrological accuracy is lacking. Lack of information about uncertainty in the labeled purity is not uncommon, and labeled and actual purities often differ. Moreover, some commercially available substances are no longer provided by reagent manufacturers due to profitability issues.
Some rare, new, or unstable substances are difficult or impossible to obtain commercially and must be isolated and purified or chemically synthesized by the analyst. This requires substantial effort. Even if preparation of such substances is possible, when their purity is determined using chromatography-based area-percentage techniques, the value may not equate to the actual purity because of error in detection sensitivity or the presence of undetectable impurities such as inorganic salts or residual solvents. The purity of natural substances with structural analogs may be overrated if these analogs are insufficiently separated. Using such substances as assay-grade standards can therefore result in assay values of questionable reliability.
Thus, the availability of reagents usable as assay-grade standards and constraints on their purity are major bottlenecks that impede the establishment of accurate quantitative analysis and analytical procedures. Laboratories, moreover, must often concurrently analyze dozens of analytes. The preparation and management of standards for each of these analytes are time-consuming and expensive. The analysis of residual pesticides in food products and environmental contaminant monitoring, for instance, sometimes require the batch analysis of multiple analytes. Maintaining reagents as assay-grade standards for all analytes is not an easy task17,18). Reagent stability has a particularly large impact on assay precision, since substances sensitive to light or heat and easily oxidized or hydrolyzed substances tend to degrade during storage. Using reagents of such compounds requires the establishment of appropriate storage conditions and periodic evaluation of changes during storage, both of which represent significant burdens on the laboratory19-21).
Relative molar sensitivity (RMS) analysis has recently attracted attention as a new analytical technique for resolving these issues22). In this article, I will discuss research on the analysis of substances in food and pharmaceutical products using RMS that I am conducting as part of an investigation to establish and apply analytical procedures that do not require assay-grade standards for the analytes used.
In an RMS assay, RMS is used to correct differences in the detection responses of substances with different chemical structures so that each substance can be determined using an alternative reference standard instead of an assay-grade standard for that analyte. In RMS assays, these alternative reference standards are defined as primary standards.
Generally, the response of a detector used in chromatography is proportional to the amount (number of moles) of a substance passing through the detector and can be expressed with the following formula22,23):

where Z is detector response, a is the molar sensitivity coefficient, and M is the molar concentration of the substance in solution. Here, the molar sensitivity coefficient for an analyte differs depending on the chemical structure and physicochemical properties of that particular substance. RMS (Vrms) is defined as the ratio of the molar sensitivity coefficients between substances and is expressed using the following formula22):
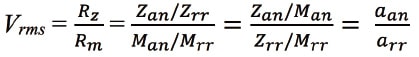
where Rz is the ratio of the responses of the detector to the analyte and the primary standard, Rm is the ratio of the molar concentrations of the analyte and the primary standard, Zan is the response of the detector to the analyte at molar concentration Man, Zrr is the response of the detector to the primary standard at molar concentration Mrr, Man is the molar concentration of the analyte (mol/L), Mrr is the molar concentration of the primary standard (mol/L), aan is the molar sensitivity coefficient for the analyte, and arr is the molar sensitivity coefficient for the primary standard.
By determining the RMS for an analyte to the primary standard, the following formula can be used to calculate the molar concentration of the analyte (Man) from that of the primary standard and the RMS22):
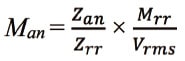
Although the analyst must have an analyte of known purity to calculate the RMS, once the RMS for an analyte relative to the primary standard is determined, that analyte can be determined with the primary standard and the RMS as long as the analytical conditions used to calculate the RMS remain the same. This is a major advantage of the RMS method. This method shows promise as a powerful tool in the analysis of compounds when an assay-grade standard is difficult or impossible to obtain. Since it produces stable values when the same conditions are used, reproducibility is easy to maintain in routine analysis. Using a CRM with an accurately known purity and uncertainty information as the primary standard allows assays with analyte metrological traceability. Since the technique works even if the physicochemical properties of the analytes allow only 1 or 2 CRMs to be used, new CRMs do not normally need to be developed. If quantitative NMR with metrological traceability (qNMR)13,24,25) is used, primary standards of the analyst’s preference can be used instead of CRMs for accurate quantification by evaluating the purity using qNMR-based valid procedures. The benefits of the RMS technique extend beyond those associated with primary standards. The instrumentation and analytical conditions currently used by the laboratory can be used without modification provided that they are acceptable. This greatly reduces the time and cost of switching and verifying the analytical procedures. These features make the RMS method a powerful tool for food and environmental analysis involving many compounds whose assay-grade standards are not readily available.
Convinced of the benefits of RMS-based a nalysis, my colleagues and I are developing analytical techniques for expensive food product ingredients and analytes whose assay-grade standards are not readily available. I will discuss how we established an analytical procedure for acteoside and pedaliin26). The laboratory where I work chemically characterized 3 iridoids and 8 polyphenols in the leaves of the sesame plant (Sesamum indicum). Through our efforts, we characterized biological activities such as 1,1-diphenyl-2-picrylhydrazyl (DPPH) radical scavenging, oxygen radical absorbance capacity, in vitro antiglycation activity, changes in the amounts of different compounds during the growth stages of sesame leaves, and the accumulation and subcellular localization of acteoside in sesame plants27-29). Of the polyphenols identified, acteoside is a major phenylethanol glycoside, and pedaliin (pedalitin-6-O-glucoside) is a flavonoid glycoside in sesame leaves (Figure 1). Acteoside demonstrated a particularly high level of protection against neurological diseases such as Parkinson’s30) and Alzheimer’s diseases31,32), showing promise as a pharmaceutical candidate28). Acteoside is typically determined using chromatography techniques such as HPLC33,34) or LC-MS/MS35). Acteoside reagents are commercially available but is relatively expensive, and no CRM is commercially available. No CRM is commercially available for pedaliin. Imagining that RMS techniques could be useful for enabling reliable quantitative analysis of these two compounds, we set to work to establish analytical methods.
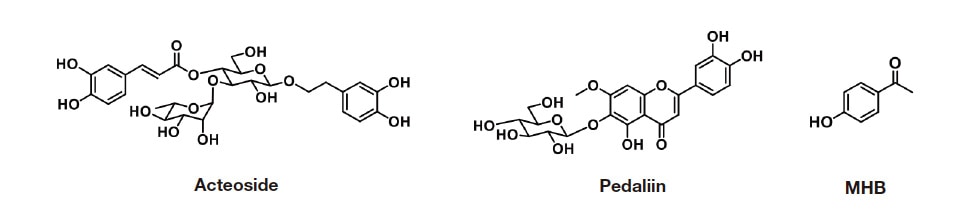
Fig. 1 Chemical structures of acteoside, pedaliin, and MHB
A commercial acteoside reagent and pedaliin isolated and purified from sesame leaves were used as analytes. Commercially available methyl p-hydroxybenzoate (MHB), which is inexpensive and stable and has been used frequently as the primary standard in RMS-based analyses, was used as the primary standard. For RMS calculations, the exact RMS relative to the primary standard was calculated, and its accuracy was evaluated using the steps shown in Figure 2. In the first step, 1H-qNMR with 1H nuclei was used to determine the purity of the reagents and the purified analytes. 1H-qNMR is a technique for determining the absolute purity of analytes. If a CRM is used as the internal reference standard, the analyte absolute purity can be calculated with a high degree of reliability13,24,25). After 1H-qNMR was used to determine the purity of the reagents and purified analytes and the primary standard, the RMS values for acteoside and pedaliin relative to MHB were calculated in step 2. The RMS can be calculated from the ratio of the HPLC peak area for the analyte to that for the primary standard36) and from the ratio of the calibration curve slope for the analyte to that for the primary standard37). We used the latter approach (Figure 3) in this investigation. Specifically:
The RMS values for acteoside and pedaliin relative to MHB are shown in Table 1. Refer to Ref. 26 for a detailed description of the HPLC conditions.
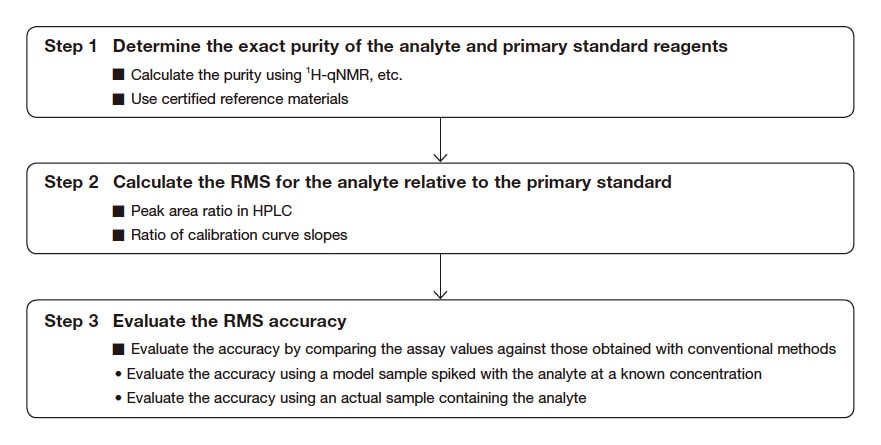
Fig. 2 Flow of RMS calculation and accuracy evaluation
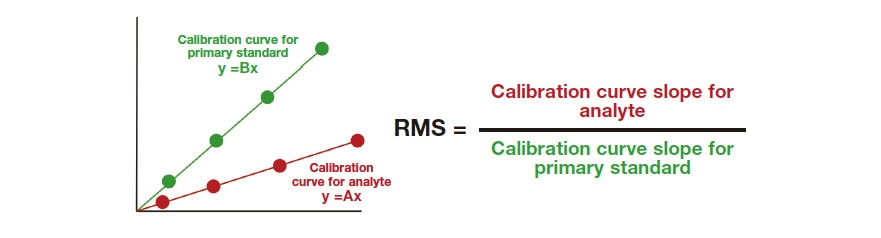
Fig. 3 RMS determined from the ratio of the calibration curve slopes for the primary standard and analytes
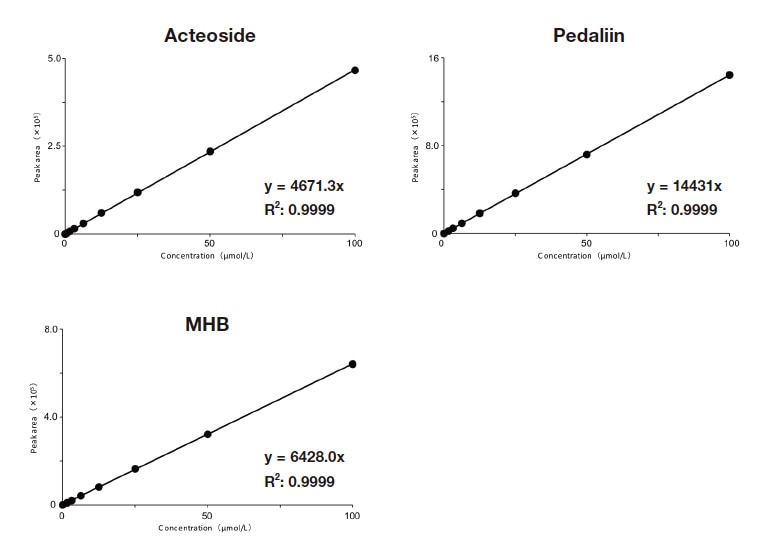
Fig. 4 Calibration curves for acteoside, pedaliin, and MHB
Table 1 RMS for acteoside and pedaliin relative to MHB

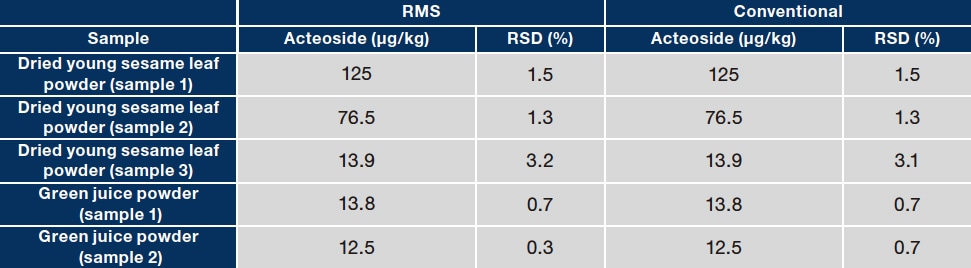
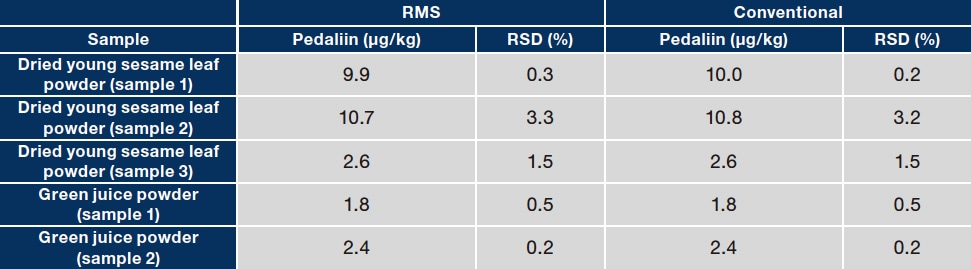
To evaluate the accuracy of the RMS values obtained in step 3, the assay values for acteoside and pedaliin determined with the RMS method were compared with those determined with a traditional absolute calibration curve method (which used assay-grade standards of the analytes). Three types of dried sesame leaf powders and two types of green juice powders were used as samples. Typical chromatograms for a dried sesame leaf powder sample (sample 1) and one green juice powder sample (sample 1) are shown in Figure 5. As shown in Table 2, the assay values determined with the two methods did not differ substantially for any sample. This demonstrates the accuracy of the RMS values obtained. This investigation shows that MHB can be used as a primary standard to establish an accurate method for the quantitative analysis of acteoside and pedaliin with metrological traceability. Although we used 1H-qNMR to determine the purity of MHB in this investigation, a CRM of MHB is commercially available and could be used to efficiently determine acteoside and pedaliin without 1H-qNMR. The analytical method developed in this investigation could be applied to the analysis of acteoside and pedaliin. Properly determining the RMS for these compounds would allow comprehensive and efficient analysis of the diverse functional components present in sesame leaves.
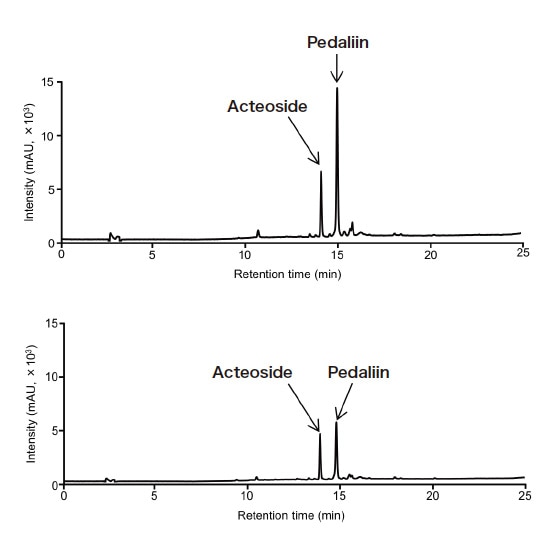
Fig. 5 Typical chromatograms for food product samples containing acteoside and pedaliin
Top: Dried young sesame leaf powder (sample 1), Bottom: Green juice powder (sample 1)
Table 2 Comparison of assay values for acteoside (A) and pedaliin (B) in food product samples as determined with RMS and conventional methods
(A)
(B)
My colleagues and I, in partnership with Hitachi High-Tech Analysis Corporation, are studying the application of RMS method to determine the blood concentrations of pharmaceutical compounds, including those related to therapeutic drug monitoring (TDM)38). The efficacy and side effects of some drugs differ from patient to patient39). A given dose of a drug may produce different effects in different patients because of disparities in blood concentrations due to factors such as weight, age, pre-existing medical conditions, and concomitant drugs. The blood concentrations of drugs with a narrow safe and effective range (i.e., therapeutic window) must be properly controlled with TDM40). In TDM, blood concentrations are determined to provide effective and safe drug therapy for individual patients, which involves evaluating the therapeutic effects and adverse reactions of the drug being used39,40). This information provided by TDM is crucial for optimizing the dosage regimen for individual patients. Blood concentrations are determined primarily using immunological assays such as enzyme-linked immunosorbent assay (ELISA)41,42), fluorescence polarization immunoassay (FPIA)43), and the enzyme multiplied immunoassay technique ( EMIT)44). Immunological assays for TDM, however, are not possible if no antibody for the analyte is commercially available. Immunoassay kits are designed to process many specimens concurrently but cannot be used efficiently when there are a small number of samples. HPLC is a rapid, straightforward technique that offers excellent analytical precision for pharmaceutical compounds. HPLC, performed under optimized conditions, resolves pharmaceutical compounds, chemical substances, and their metabolites in biological samples45-51). Hitachi High-Tech Analysis Corporation developed a high-performance liquid chromatograph (LM1010) specifically for determining blood drug concentrations at medical institutions, and it has been shown to perform better than conventional systems for its intended purpose50-53). Unlike conventional HPLC systems, everything from pre-analysis conditioning and sample analysis to data analysis in the LM1010 system is automated. The system provides stable assay values regardless of the operator’s level of knowledge and experience. The ability of the system to process a sample in approximately 7 min makes for an efficient analytical workflow that includes column washing and re-equilibration. Since hospitals can rapidly determine blood drug concentrations using this instrument, HPLC will likely play an even greater role in drug concentration analysis at medical institutions. HPLC, however, sometimes requires rare or expensive reference materials that can be a financial burden for the user. Unstable reference materials can also be problematic because they may degrade during storage, causing reliability issues in terms of reference material control, provision, and analysis. Properly applied to resolve these issues, RMS method could eliminate the need to purchase and control multiple expensive reference materials, thereby greatly reducing the financial burden on the medical institution and expanding the number of analyzable analytes. Combining the LM1010 with RMS method could greatly increase the precision, efficiency, and affordability of drug concentration analysis at medical institutions, helping them tailor drug therapy to individual patients.
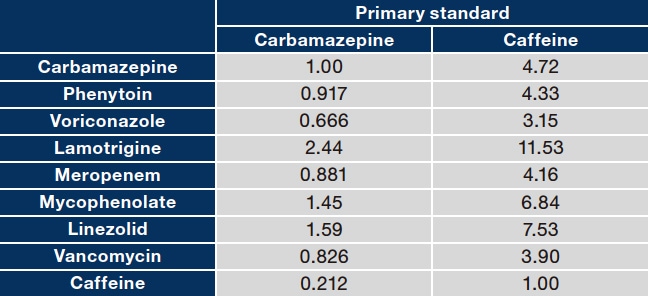
To improve the reliability and efficiency of blood drug concentration analysis, we established RMS-based quantification methods for carbamazepine, phenytoin, voriconazole, lamotrigine, meropenem, mycophenolic acid, linezolid, vancomycin, and caffeine (Figure 6). We selected carbamazepine and caffeine as the primary standards for the investigation because CRMs of these substances are available and stable. The RMS values were calculated and assessed for accuracy using the steps shown in Figure 2. Standard solutions for each calibration curve prepared based on the certified purities of the analytes and primary standard CRMs were analyzed using the LM1010 (study instrument) under default analytical conditions. The calibration curves were then plotted. The RMS values for the analytes relative to the primary standards were calculated from the ratio of the slopes (slope of analyte to slope of primary standard) (Table 3). To assess the accuracy of the resulting RMS values, the drug concentrations in control serum samples spiked with each analyte (carbamazepine, phenytoin, voriconazole, meropenem, mycophenolic acid, linezolid, and vancomycin) at one or two concentrations were determined and compared with the values determined using a conventional absolute calibration curve method. (See Ref. 38 for detailed data.) These assessments showed that the primary standards and corresponding RMS values were accurate and that when carbamazepine or caffeine is used as the primary standard, the analytes can be accurately determined by the RMS approach.
The LM1010 HPLC system is being increasingly used in the emergency department and intensive care settings, where it is expected to contribute to TDM and rapid diagnostics for drug poisoning. Given that the RMS method enables the determination of any analyte based on one primary standard that is stable and has accurate purity information, RMS could be applied to LM1010 analyses to eliminate the need to plot calibration curves for individual analytes, which would simplify the analytical process, shorten analysis times, and allow drug doses to be appropriately adjusted based on reliable assay values, thereby further increasing the efficacy and safety of pharmacotherapy.
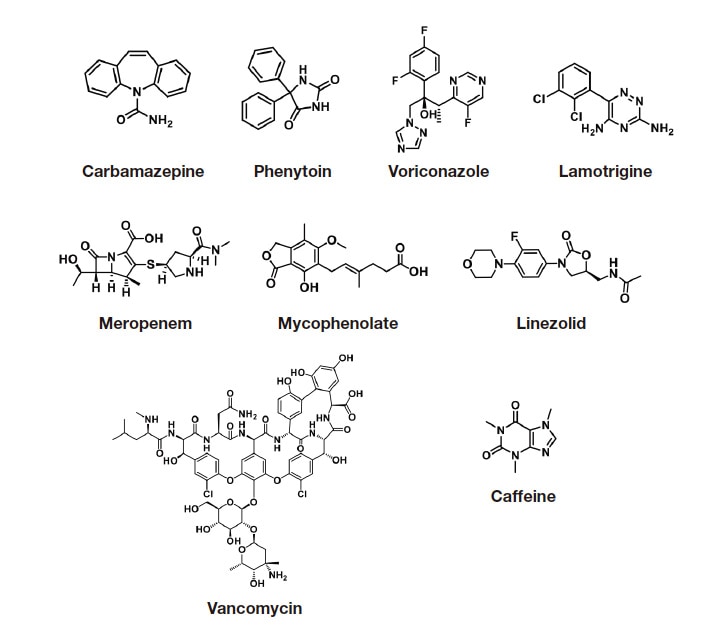
Fig. 6 Chemical structures of the 9 analytes studied
Table 3 RMS values for 9 analytes relative to each primary standard
The RMS method is being increasingly applied in Japan in fields including the analysis of food ingredients and natural compounds54-61), food additives62-64), and pharmaceuticals65). RMS methods are also being adopted in compendial monographs, such as the assay for perillaldehyde in a crude drug, Perilla Herb, in the Japanese Pharmacopoeia and the following assay procedures in Japan’s Specifications and Standards for Food Additives: Mogroside V in monk fruit, allyl isothiocyanate in mustard extract and horseradish extract, Capillin in Artemisia capillaris extract, and carminic acid in cochineal extract23). Efforts are also underway to standardize the RMS method, such as the establishment of JAS 0031:2025: General Requirements for Quantitative Methods Using Relative Molar Sensitivity in Food by the Japanese Ministry of Agriculture, Forestry, and Fisheries in 202522).
As detailed in this article, RMS methods are both accurate and practical, bringing about the seemingly contradictory requirements of ensuring metrological traceability and improving analytical efficiency. As this method continues to develop, more findings regarding its application to the quantification of a wider range of organic compounds will emerge, opening new frontiers in HPLC-based assays.
References
See more
