Kai Maruyama
In recent years, the challenge of responding to various societal trends—including diminishing workforces, calls to improve workplace environments for front-line workers, and demands for stable production processes and streamlined manufacturing—has spurred rapid advances in automation, digitization, and the adoption of smart factories throughout the manufacturing industry. Traditional approaches to production-process management tend to invoke a multi-stage process (Figure 1): (1) Test specimens at various intermediate stages of the production process are sampled from manufacturing plants. (2) Sampled specimens are transported from manufacturing sites to quality-control facilities or analytical laboratories. (3) A variety of pre-processing steps are applied, after which (4) measurements are performed using various analytical instruments to gather benchmark data. Analyzing the results of these measurements—and interpreting them on the basis of accumulated knowledge—then yields insights into the state of the manufacturing process that may be used to implement process controls. However, conventional process-management techniques of this sort suffer from a number of drawbacks: in particular, the lengthy time lag between specimen sampling and data acquisition makes it difficult to implement rapid process control, while the tendency for different workers to perform tasks in different ways introduces significant task variance and creates personnel-retention problems. Moreover, at some manufacturing plants the sampling of test specimens is itself a dangerous task, creating a need for improved strategies to protect the health of front-line workers and the safety of working environments. Finally, from a managerial perspective, the increasing lead times required for specimen sampling, data measurement, and process control(adjustment), and the risk of costly losses resulting from delayed detection of irregularities, pose myriad hurdles to the goals of stabilizing and streamlining production.
To address these shortcomings, Hitachi High-Tech proposes the novel concept of process monitoring systems, in which analytical instruments connect directly to manufacturing lines and manufacturing-control devices to enable automated continuous measurements and automatic process control based on measured data (Figure 2).
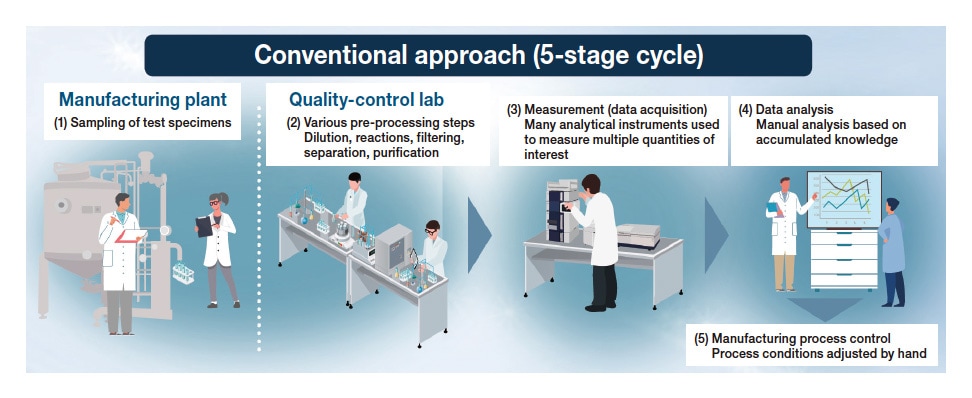
Fig. 1 Conventional approach to process management.
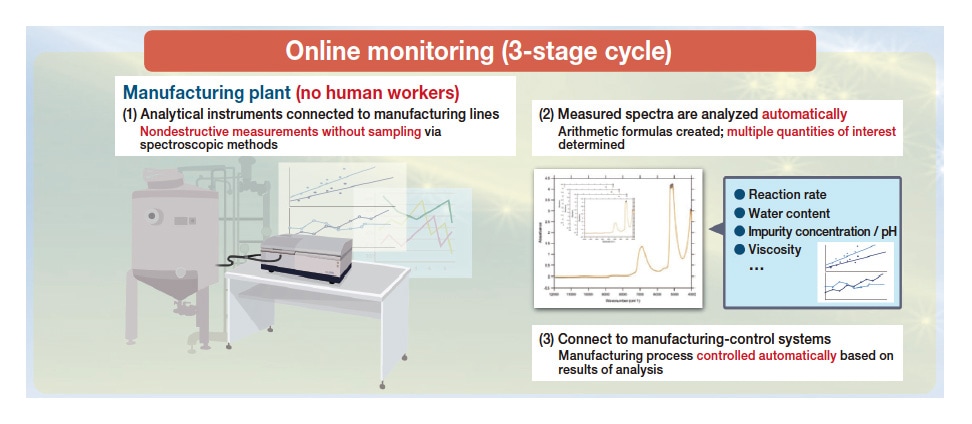
Fig. 2 New process-monitoring concept proposed by Hitachi High-Tech.
Spectrophotometers and fluorescence spectrophotometers are spectral-analysis instruments that use light at ultraviolet, visible, and infrared wavelengths to perform measurements yielding information on the types and concentrations of substances present in a measurement sample.
These instruments offer a host of key advantages allowing them to satisfy the essential requirements of process-monitoring systems; in particular,
Moreover, through the use of optical fibers, these instruments can acquire data from measurement samples at remote locations, thus allowing monitoring of dangerous or inaccessible regions.
As an additional bonus, techniques of multivariate analysis may be exploited to relate measured spectral data to conventional quality-control benchmarks; this allows quality-control benchmarks—even those whose measurement requires complex pre-processing and time-consuming analytical procedures—to be monitored continuously and in real time. Indeed, it is even possible to monitor multiple quality-control benchmarks simultaneously by constructing analytical models encompassing the full desired set of benchmarks.
Figure 3 shows one example of how a process-monitoring system might be structured. In this case, a manufacturing facility (the "manufacturing side") is connected to a set of analytical instruments (the "measurement side") via a detector unit. The specific implementation of the detector unit depends on the target substances to be measured and the local environment in the manufacturing facility; for example, the detector unit might consist of
The use of optical fibers requires manufacturing facilities to be equipped with sight glasses or other optically-transparent components. Depending on the properties of the target substances to be measured and the quality-control benchmarks to be obtained, the analytical instruments may use methods such as absorption or fluorescence spectroscopy and may measure wavelengths in the ultraviolet, visible, or infrared regimes. If these instruments are installed in the vicinity of manufacturing facilities, they must be enclosed in protective boxes equipped with safety features, as well as mechanisms to prevent moisture and dust contamination. The system software will include functionality to enable continuous measurement and multivariate analysis, and will also support data input/output and identification procedures. Output data will be sent to the data input/output unit, and communication with the control unit will be established via analog signals, contact signals, or similar methods, to connect analytical instruments to manufacturing facilities.
The structure described above would allow monitoring of manufacturing processes based on data acquired without sampling through the use of spectrophotometers and it could be used to implement manufacturing process controls based on real-time measured data.
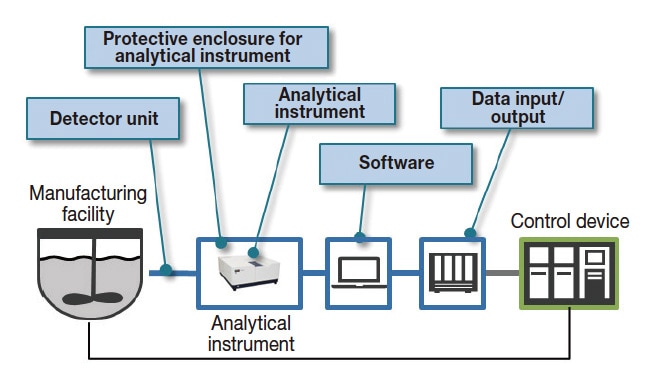
Fig. 3 One example of system structure.
The structure of this system requires the detector unit to assume a particularly large number of distinct forms. When the substance to be measured is a low-viscosity liquid, the usual strategy is to bypass samples from the manufacturing side and deliver them to the measurement side. However, in cases where it is difficult to install analytical instruments in the vicinity of manufacturing facilities, the instruments will be installed in laboratories or analysis centers somewhat distant from the manufacturing side, and a detector unit comprising optical fibers and flow cells will be installed on the manufacturing side. This approach allows measurements to be performed from remote locations. Flow cells may be configured with arbitrary optical path lengths, allowing support for samples spanning a wide range of concentrations (Figure 4). When the substance to be measured is a high-viscosity liquid, or when measuring liquid or solid samples containing particles or other immiscible components, or in cases where transmission measurements are difficult or where fluorescence is to be detected, the sample is irradiated with light and a probe bundled with optical fibers is used to capture reflected light or fluorescent emissions. As this discussion indicates, by making flexible use of optical fibers and exploiting a key advantage of spectroscopic methods—namely, that they require no sample preprocessing—we obtain systems capable of measuring a diverse spectrum of measurement targets.
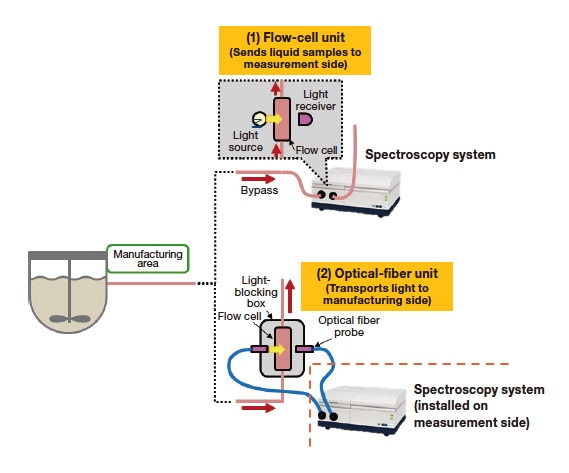
Fig. 4 One example of detector unit applied in practice.
In designing the software module that will control analytical instruments for continuous measurements, we assume this software will be used at manufacturing sites, and thus adopt a bare-bones design implementing only necessary functionality with extraneous features minimized (Figure 5). Measured spectra are pre-processed as necessary to be converted, via pre-constructed analytical models, into expected values of control benchmarks; these values are then sent to higher-level control devices via the data input/output unit—and, simultaneously, plotted within the software module as time-varying data, allowing measured values to be read off at a glance at manufacturing sites (Figure 6).
In addition, various types of process data such as the temperatures of measurement targets are also collected through the data input-output unit and may be combined with spectral data to enable applied forms of analysis.
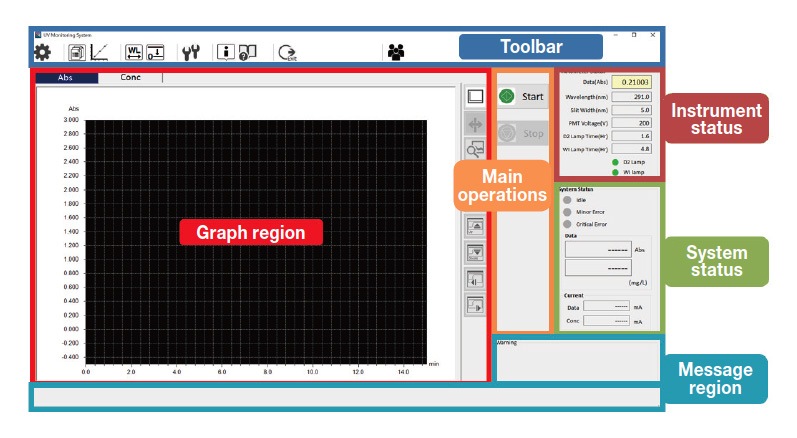
Fig. 5 One example of software GUI window design.
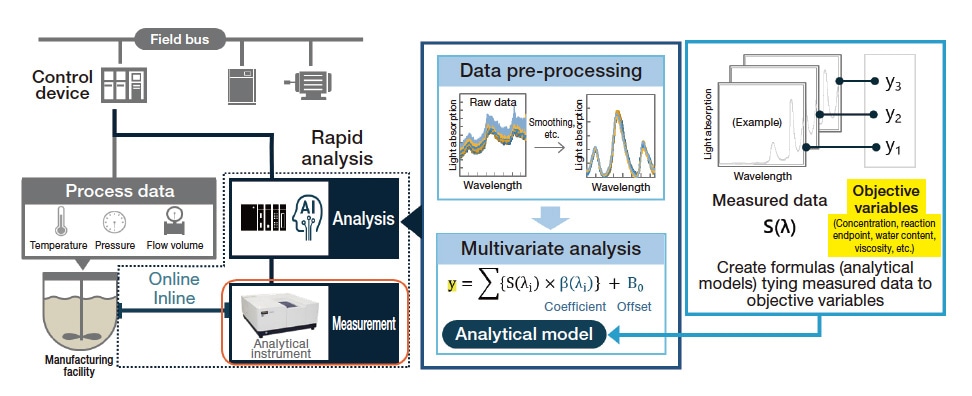
Fig. 6 Full system application.
Adopting process-monitoring systems eliminates the need for workers at manufacturing sites to sample test specimens and make measurements by hand—and also eliminates the need for expert users with extensive analytical experience to analyze data on a regular basis. Technological evolutions of this nature promise not only to reduce workflow burdens on front-line workers, but also to slash personnel costs, cut manufacturing lead times, improve production volumes, and reduce product losses, creating value in many different ways.
The discussion in this article focused on manufacturing processes, but similar systems and techniques could also be deployed at R&D facilities, where they would offer similar advantages: automating analytical tasks reduces workloads and standardizes results by eliminating the dependence on the personal characteristics of individual human operators. For applications to R&D settings, analytical instruments could be connected to robot systems, autosamplers, heating systems, and other pre-processing units to further reduce human workloads and promote automation, thus enabling a broad range of automation and process-monitoring solutions for deployment in R&D environments.
About the author
Kai Maruyama
Application Development Center
Hitachi High-Tech Analysis Corporation
See more