
Noriyuki Sumida
PhD
Bio Systems Design 1st Department
Life & Medical Systems Product Division
Analytical & Medical Solution Business Group
Hitachi High-Tech Corporation

Yoshiyuki Ohtsubo
PhD
Associate Professor
Microbial Genetics and Evolution Laboratory
Graduate School of Life Sciences
Tohoku University
The DS3000 Compact CE Sequencer (DS3000) is a capillary electrophoresis system featuring a high-sensitive fluorescent signal detector. The DS3000, currently marketed as a DNA sequencer, can be adapted into a capillary electrophoresis system with a broad range of applications by selecting appropriate separation media (polymers) and conditions. In particular, polymers are supplied to capillaries from pop-in cartridges that are readily installed, allowing the polymer type to be easily changed from one type to another depending on the analytical demand. Due to our innovative polymer-filling system, in which the polymer in the cartridge is supplied to capillaries through direct contact of the cartridge and capillaries, switching of the polymer cartridge does not result in waste of polymer. These product features enable flexible system operation with a different choice of polymer for each different analytical objective, making the system a powerful tool for researchers studying DNA, RNA, proteins, and etc. In this article, we demonstrate the versatile capabilities of the DS3000 by utilizing it to conduct a gel shift assay.
Gel shift assays, also known as electrophoretic mobility shift assays (EMSA), are extensively employed in molecular biology to investigate protein-DNA interactions. During electrophoresis, DNA devoid of proteins migrates at a certain speed, while when complexed with proteins, it moves at a slower pace due to alterations in size and shape. These assays have been widely utilized to study a variety of biological processes involving DNA-binding proteins, such as transcriptional regulation, DNA replication, recombination, and etc.
In DNA sequencing, the DS3000 and other DNA sequencers separate single-stranded DNA under denaturing conditions by electrophoresis. Typical methods for achieving denaturing conditions include running samples at high temperatures— typically 60°C—and using polymers containing urea or other denaturing agents. In contrast, gel shift assays require electrophoresis under non-denaturing conditions to maintain DNA-protein binding. To achieve the non-denaturing conditions, it is important to choose polymers that are free of denaturing agents and to conduct electrophoresis at relatively low temperatures below 40°C.
The polymer used in this work is a POPTM conformational-analysis polymer (CAP, Thermo Fisher Scientific, 4340379) which does not contain denaturing agents. We set a low electrophoresis temperature of 40°C. The DS3000 controls the electrophoresis temperature by keeping capillaries in an oven; the oven temperature can be changed from the DS3000 control screen. In this work we set the oven temperature to its lowest possible setting, 40°C.
We next sought for a proper CAP concentration. If the CAP concentration is too low, double-stranded DNAs are not separated; on the other hand, if the CAP concentration is too high then it cannot be filled inside the capillary. After the investigation, we determined to dilute 9% stock solution to 6% with the standard electrophoresis buffer which simultaneously allows separation of double-stranded DNAs while ensuring that capillaries are filled (Figure 1A).
Analysis of DNA-protein binding is often carried out in a 10-150 mM salt solution, in order to mimic the intracellular environment. However, the presence of salt in sample solutions decreases the efficiency with which analytes in sample solutions are injected into capillaries, reducing the intensity of fluorescent signals (Figures 1B,C). This is because salt reduces the electrical resistance of sample solutions, preventing the application of sufficient voltage to the sample solution during sample injection (Ref. 1). The sample-injection efficiency can be improved by modifying the sample injection conditions. The run-control software of the DS3000 sequencer allows for the adjustment of injection time and injection voltage settings. The injection voltage and injection time are positively correlated with signal intensity, but negatively correlated with resolution (Ref. 2), and thus these sample-injection conditions must be carefully tuned to achieve a good balance between signal intensity and resolution. Figure 2 compares signal intensities obtained by sample injection voltages of 1.6 and 6.4 kV. For an injection voltage of 6.4 kV, we achieved robust signal detection even for a sample containing 150 mM salt (Figure 2AB).
The fluorescence signal intensity is further increased by adding salt to the polymer (Figure 2C). The addition of salt reduces the electric resistance of the polymer, allowing for a higher voltage to be applied to the sample-solution portion.
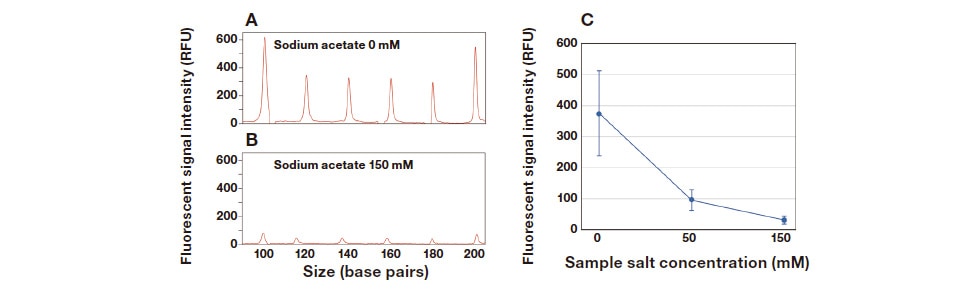
Fig. 1 Detection of double-stranded DNA via capillary electrophoresis and impact of salt concentrations on signal intensity.
A. Electropherogram obtained by analyzing a double-stranded DNA solution. A 9% CAP stock solution was diluted to 6% with an electrophoretic buffer for this run.
B. Electropherogram obtained after adding 150 mM (final concentration) sodium acetate to double-stranded DNA solution. Although peaks can be observed, the signal intensity is lower than in plot A.
C. Relationship between the signal intensity and sample salt concentration. Plotted values are average intensities of 44 peaks obtained over two electrophoresis runs. The signal intensities represent peak heights computed using GeneMarker v3.0.1 (SoftGenetics). Electropherograms are shown only for lengths ranging from 100 to 200 base pairs.
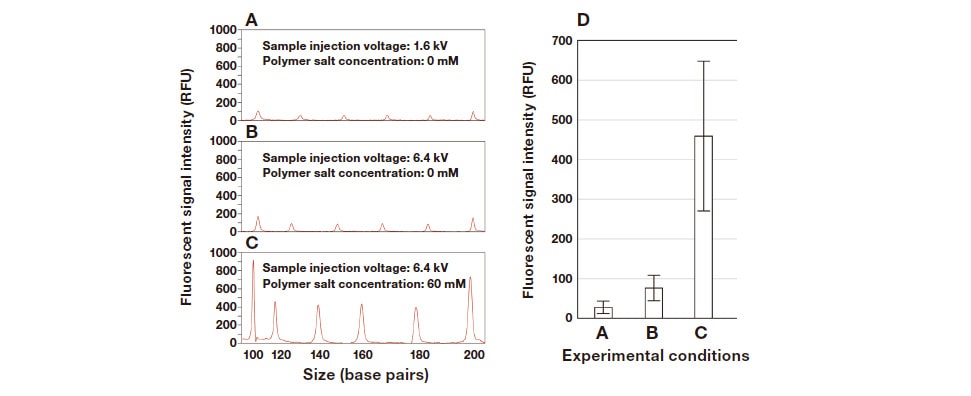
Fig. 2 Injection efficiency for salt-containing samples.
A-C. Electropherograms obtained by analyzing double-stranded DNA in a solution containing 150 mM (final concentration) sodium acetate. Sample-injection voltages and polymer salt concentrations are indicated in each subplot. Electropherograms are shown only for lengths in the range of 100-200 base pairs.
D. Mean values of 88 peak signal height obtained from 4 electrophoresis runs under various conditions. Error bars indicate standard deviations. Labels A-C corresponds electrophoresis conditions (sample-injection voltage and polymer salt concentration) in panels A to C.
BphS protein is a transcription repressor that binds to specific DNA sequences. The interaction between BphS protein and a specific DNA sequence (pE promoter) has been studied in detail and serves as an excellent model system (Ref. 3). In electrophoresis runs carried out under the conditions indicated in Figure 3, we observe the emergence of two peaks as the concentration of BphS protein increases. These shift peaks were observed at BphS concentrations of 45 nM and higher. All of these observations agree with the results reported in Ref. 3. These findings highlight the capability of the DS3000 to measure the binding of BphS protein to the pE promoter.
This report demonstrates that the DS3000 can be used to conduct gel shift assays. Using the DS3000 for this purpose offers several advantages, including the following:
To prepare the polymer, we purchased POP Conformational Analysis Polymer (concentration 9%; Thermo Fisher Scientific, 4340379), then diluted the polymer concentration to 6% by adding water together with 310 And 31xx Running Buffer, 10× (Thermo Fisher Scientific, 402824). (The final concentration of Running Buffer was 1×.) 310 And 31xx Running Buffer (final concentration 1×) was also used as an electrophoresis buffer. DNA used for the gel shift assay (pE promoter) and BphS protein were prepared following the procedure described in Ref. 3.
DNA-protein complexes were formed using 0.1 nM DNA in 0.1× PBS with various concentrations of BphS protein (listed in Figure 3). The size standard we use is an ILS600 (Promega®, DG1071). Electrophoresis was carried out at an applied voltage of 13 kV and an oven temperature of 40°C.
The sample injection conditions are indicated in the figures above. The peak-waveform plots in Figures 1 and 2 were prepared based on numerical data from individual frames obtained via GeneMarker v3.0.1 (SoftGenetics); this software package was also used to compute the peak heights used to calculate fluorescence signal intensities. The electrophoresis diagrams in Figure 3(A, B) were prepared using TraceViewerForMolecularBiology (Ref. 4).
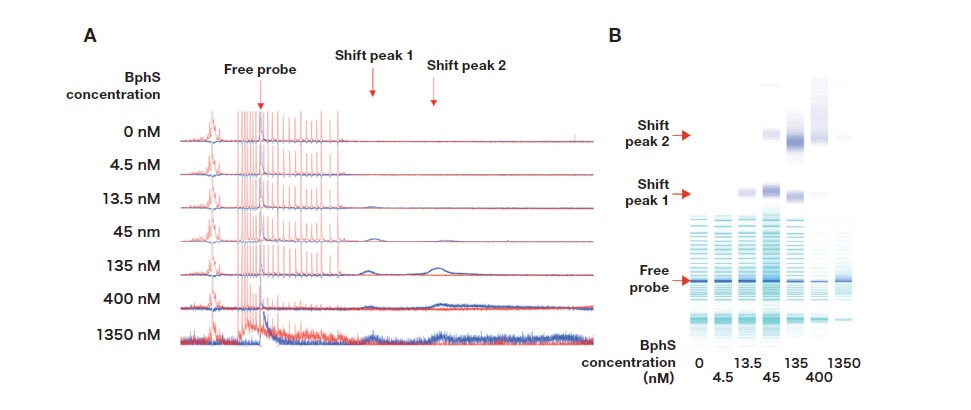
Fig. 3 Analysis of interactions between BphS and DNA (pE promoter).
A. Electropherograms obtained by electrophoresis of a solution containing BphS protein and pE promoter. Red peaks indicate signals from the size standard. Blue peaks indicate signals from the pE promoter DNA.
B. Gel-like image. Cyan peaks indicate signals from size standard. Blue peaks indicate signals from pE promoter DNA. At BphS concentrations of 45 nM and higher 2 shift peaks were observed. The label "free probe" indicates signals from pE promoters unbound to BphS, while the shift peaks indicate signals from pE promoters bound to BphS. Signals from the size standard grow weaker as the concentration of BphS protein increases, which could be attributable to salt contained in the protein solution. The sample was injected under an applied voltage of 9.6 kV with an injection time of 9 s.
References
The gel shift assay performed in this work involves using the DS3000 in ways that differ from standard operating procedures. Readers interested in further details of this technique are encouraged to contact Noriyuki Sumida at Hitachi High-Tech Corporation.
