
Environmental Performance Data Highlights
GHG emissions throughout the value chain
In order to enhance the credibility of this report, FY2025 figures marked with
 have received independent assurance from SOCOTEC Certification Japan Co., Ltd. in accordance with the
International Standard on Assurance Engagements (ISAE) 3000 and ISO14064-3.
| Boundary | Unit*1 | FY2021 | FY2022 | FY2023 | FY2024 | FY2025 | |
|---|---|---|---|---|---|---|---|
| Total Scope 1*2 *5、 2*3 *5and 3*4 *6 | Consolidated | t-CO2e | 1,776,362 | 2,052,415 | 2,015,773 | 2,045,357 |
2,273,031
|
| Total Scope 1 and 2 | Consolidated | t-CO2e | 43,325 | 42,108 | 40,336 | 34,479 |
32,334
|
| Scope 1 | Consolidated | t-CO2e | 7,003 | 7,306 | 6,475 | 6,892 |
5,077
|
| Scope 2 Market-based | Consolidated | t-CO2 | 36,321 | 34,801 | 33,861 | 27,587 |
27,257
|
| Location-based | Consolidated | t-CO2 | 52,268 | 51,981 | 62,152 | 64,337 |
66,072
|
| Scope 3 Total | Consolidated | t-CO2 | 1,733,038 | 2,010,308 | 1,975,437 | 2,010,878 |
2,240,697
|
| Scope 3 Upstream (other indirect emissions) | Consolidated | t-CO2 | 947,406 | 1,163,918 | 1,217,373 | 1,293,923 |
1,416,682
|
| 1. Purchased goods and services | Consolidated | t-CO2 | 874,226 | 1,077,869 | 1,086,796 | 1,184,289 |
1,255,011
|
| 2. Capital goods | Consolidated | t-CO2 | 48,577 | 59,811 | 105,149 | 80,603 |
132,454
|
| 3. Fuel- and energy- related activities not included in Scope 1 and 2 | Consolidated | t-CO2 | 8,650 | 8,703 | 10,170 | 10,730 |
11,077
|
| 4. Upstream transportation and distribution | Consolidated | t-CO2 | 7,171 | 10,192 | 6,939 | 8,161 |
7,854
|
| 5. Waste generated in operations | Consolidated | t-CO2 | 721 | 804 | 904 | 1,359 |
930
|
| 6. Business travel | Consolidated | t-CO2 | 1,469 | 1,313 | 1,525 | 1,649 |
1,768
|
| 7. Employee commuting | Consolidated | t-CO2 | 6,589 | 5,223 | 5,890 | 7,131 |
7,588
|
| 8. Upstream leased assets | Consolidated | t-CO2 | (Included in Scope 1,2) |
(Included in Scope 1,2)
|
|||
| Scope 3 Downstream (other indirect emissions) | Consolidated | t-CO2 | 785,632 | 846,389 | 758,063 | 716,955 |
824,014
|
| 9. Downstream transportation and distribution | Consolidated | t-CO2 | 5,827 | 29,717 | 56,382 | 77,311 |
59,421
|
| 10. Processing of sold products | Consolidated | t-CO2 | (Not applicable) |
(Not applicable)
|
|||
| 11. Use of sold products*4 | Consolidated | t-CO2 | 774,263 | 807,817 | 689,517 | 632,093 |
756,841
|
| 12. End-of-life treatment of sold products | Consolidated | t-CO2 | 5,540 | 8,854 | 12,164 | 7,551 |
7,752
|
| 13. Downstream leased assets | Consolidated | t-CO2 | (Included in No. 11) |
(Included in No. 11)
|
|||
| 14. Franchises | Consolidated | t-CO2 | (Not applicable) | ||||
| 15. Investments | Consolidated | t-CO2 | (Not applicable) | ||||
*1Due to the number of displayed digits, the total individual values and those for each line may differ in some cases.
*2Direct emissions of greenhouse gases from the organization itself. Includes greenhouse gases from non-energy sources.
*3Indirect emissions due to the use of electricity and heat supplied by other companies. Number in <> is by location basis.
*4Indirect emissions not included in Scopes 1 and 2.
*5Reporting boundary for Scopes 1 and 2 emissions: Hitachi High-Tech Group companies (excluding two overseas subsidiaries)
*6
Reporting boundary for Scope 3 emissions: Hitachi High-Tech, Hitachi High-Tech Group companies in
Japan, and manufacturing group companies outside Japan.
However, the scope of coverage for the
following categories is as follows:
- Category 1: Excluding Hitachi High-Tech’s head office, sales group companies, and service group companies.
- Category 3: All sites worldwide excluding Hitachi High-Tech Ireland and Hitachi High-Tech Israel.
*7The Category 1 calculation method changed from FY2021.
*8Category 9 is calculated from FY2021.
Environmental load from operations
In order to enhance the credibility of this report, FY2025 figures marked with have received independent assurance from SOCOTEC Certification Japan Co., Ltd. in accordance with the International Standard on Assurance Engagements (ISAE) 3000 and ISO14064-3.
Energy Consumption
| Boundary | Unit | FY2021 | FY2022 | FY2023 | FY2024 | FY2025 | ||
|---|---|---|---|---|---|---|---|---|
| Energy Consumption | Total Energy Consumption | Consolidated | MWh | 124,746 | 125,638 | 146,779 | 155,565 | 162,774 |
| Renewable Energy | Consolidated | MWh | 45,044 | 48,099 | 63,512 | 90,623 | 99,625 | |
| Non-renewable Energy | Consolidated | MWh | 79,702 | 77,539 | 83,267 | 64,942 | 63,149 | |
| Renewable Energy Ratio | Consolidated | % | 36.1 | 38.3 | 43.3 | 58.3 | 61.2 | |
Waste
Waste and valuables generated
| Boundary | Unit | FY2021 | FY2022 | FY2023 | FY2024 | FY2025 | ||
|---|---|---|---|---|---|---|---|---|
| Waste Generated | Total Weight | Consolidated | t | 2,173 | 2,412 | 2,710 | 2,686 | 2,851 |
| Recycle | Total Weight | Consolidated | t | 2,108 | 2,308 | 2,696 | 2,685 | 2,851 |
| Landfil | Consolidated | t | 1.8 | 1.5 | 1.6 | 0.7 | 0.4 | |
Promotion of Plastic Resource Circulation
| Boundary | Unit | FY2021 | FY2022 | FY2023 | FY2024 | FY2025 | ||
|---|---|---|---|---|---|---|---|---|
| Plastic Waste | Generated | Major Sites | t | - | 346 | 301 | 545 | 645 |
| Recycled | Major Sites | t | - | 343 | 298 | 544 | 644 | |
| Recycling Rate | Major Sites | % | - | 99.3 | 99.1 | 99.9 | 99.9 | |
* Reporting boundary: Hitachi High-Tech's main production sites and offices
Water Resources
Water Withdrawal
| Boundary | Unit | FY2021 | FY2022 | FY2023 | FY2024 | FY2025 | ||
|---|---|---|---|---|---|---|---|---|
| Water Withdrawal | Total | Consolidated | m3 | 485,594 | 484,568 | 559,389 | 594,689 | 529,447 |
| Recycled water (Recycled from the wastewater of other organizations) | Consolidated | m3 | 1,675 | 2,000 | 300 | 2,546 | 4,711 | |
Water Discharge
| Boundary | Unit | FY2021 | FY2022 | FY2023 | FY2024 | FY2025 | ||
|---|---|---|---|---|---|---|---|---|
| Water Discharge | Total | Consolidated | m3 | 448,824 | 420,930 | 474,472 | 500,728 | 476,912 |
Water Consumption
| Boundary | Unit | FY2021 | FY2022 | FY2023 | FY2024 | FY2025 | ||
|---|---|---|---|---|---|---|---|---|
| Water Consumption | Total | Consolidated | m3 | 36,769 | 63,638 | 84,917 | 93,961 | 52,535 |
Management of Chemical Substances
| Boundary | Unit | FY2021 | FY2022 | FY2023 | FY2024 | FY2025 | ||
|---|---|---|---|---|---|---|---|---|
| Chemical substances discharged | Total | Manufacturing Sites | t | 3.8 | 3.8 | 4.4 | 4.0 | 4.1 |
| Chemical substances discharged (VOC,etc) | Manufacturing Sites | t | 3.8 | 3.8 | 4.4 | 4.0 | 4.1 |
|
| SOx (sulfur oxides) | Manufacturing Sites | t | 0 | 0 | 0 | 0 | 0 | |
| NOx (nitrogen oxides) | Manufacturing Sites | t | 0 | 0 | 0 | 0 | 0 | |
* Reporting boundary: Hitachi High-Tech manufacturing sites and Group manufacturing companies in Japan
| Boundary | Unit | FY2021 | FY2022 | FY2023 | FY2024 | FY2025 | ||
|---|---|---|---|---|---|---|---|---|
| Quantity of Chemical Substances Subjected to PRTR Law Emitted and Moved | Total | Manufacturing Sites | kg | 1,099 | 926 | 1,353 | 1,860 | 1,125 |
* Reporting boundary: Hitachi High-Tech manufacturing sites and Group manufacturing companies in Japan
Environmental Accounting
Since fiscal 2001, our group has introduced environmental accounting as a management tool for environmental conservation activities. We examine the effectiveness of environmental conservation outcomes in relation to the costs incurred, and evaluate our group’s initiatives in environmental activities.
In order to achieve the goals of the shared long-term environmental targets of the Hitachi Group, "Hitachi Environmental Innovation 2050" (1. Decarbonization, 2. Circular Economy, and 3. Nature Positive), the Environmental Committee, along with its subordinate subcommittees and meetings, implements measures and manages targets. Through the execution of these measures and the setting of target values, we strive to accurately grasp environmental conservation costs and enhance the effectiveness of environmental conservation.
In fiscal 2025, among the costs within the business site area, environmental conservation costs increased by 223 million yen compared to the previous year. This was due to factors including the replacement of air conditioning equipment in the ND Building at the Naka site.
Additionally, management activity cost (costs associated with management activities for environmental conservation) increased by 2,047 million yen compared to the previous year, due to factors including the expansion of initiatives to promote environmental conservation activities.
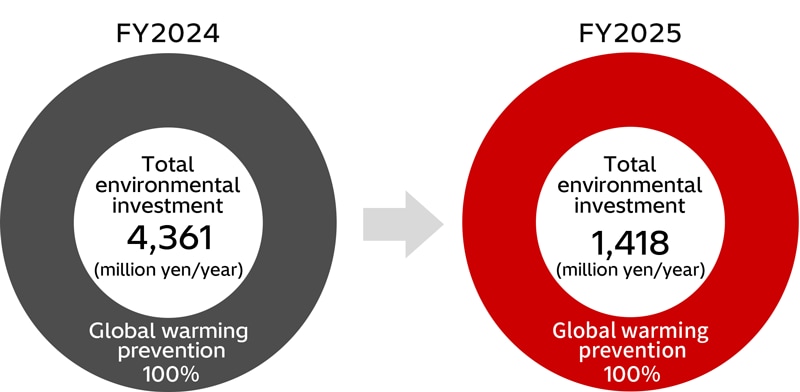
Environmental investment costs decreased by 2,944 million yen compared to the previous year, mainly because large-scale investments had been made in the previous year.
* The charts below have been formulated in compliance with the Ministry of the Environment's Environmental Accounting Guidebook II.
* Calculation Standards
-
Scope of calculation:
Hitachi High-Tech Group (head offices, branches in Japan, manufacturing division in Japan), manufacturing Group companies in Japan, headquarters of sales Group Companies, and headquarters of service Group company (Hitachi High-Tech Fielding Corporation) - Period covered:
April 1, 2024 - March 31, 2025 -
Costs:
Includes labor costs, R&D costs, depreciation costs, etc. -
Effects:
Net earnings effect: Earnings from operations relating to environmental conservation
Cost reduction effect: Sum by which costs are reduced as a result of measures to reduce the environmental burden (does not include expected effects)
Environmental Conservation Costs
| Classification | FY2024 | FY2025 |
Increase/ Decrease |
Notes | |
|---|---|---|---|---|---|
|
1. Business area costs Cost of minimizing the environmental burden arising from business activities in each business area |
1,553 | 1,832 | 279 | Costs associated with reducing environmental risks | |
| Breakdown |
Pollution prevention costs Cost of preventing pollution, including air, water, and soil pollution |
150 | 173 | 24 | |
|
Environmental conservation costs Costs associated with the prevention of global warming and energy conservation |
1,182 | 1,404 | 223 | ||
|
Resource recycling costs Costs associated with resource conservation and waste reduction and recycling |
222 | 255 | 33 | ||
|
2. Upstream and downstream costs Cost of minimizing the upstream/downstream environmental burden arising from business activities |
317 | 40 | -277 | ||
|
3. Administration costs Cost of management activities focused on environmental conservation |
900 | 2,947 | 2,047 | Costs associated with promoting activities | |
|
4. R&D costs Cost of R&D activities |
1,587 | 1,393 | -194 | ||
|
5. Social activity costs Cost of social projects |
47 | 131 | 84 | ||
|
6. Other Environmental remediation costs |
1 | 1 | 0 | ||
| Total expenses of environmental conservation (1-6) | 4,405 | 6,344 | 1,939 | ||
| All environmental conservation costs - environmental conservation effects (economic effects) | 4,333 | 6,259 | 1,926 | ||
* There were no environmental fines or penalties during the fiscal year.
* The totals of each item and the values in the total column may differ due to the number of digits displayed.
Unit: ¥1 million/year
Environmental Conservation Benefit
| Item | Conservation Benefit (FY2024) | Conservation Benefit (FY2025) | |
|---|---|---|---|
| Economic benefit | Net earnings effect | 38 | 35 |
| Cost reduction effect | 34 | 50 | |
| Total | 72 | 85 | |
Unit: ¥1 million/year
| Classification | FY2024 | FY2025 | Increase/Decrease |
|---|---|---|---|
| Total environmental investment | 4,361 | 1,418 | -2,943 |
Unit: ¥1 million/year
Breakdown of Environment-related Investment by Purpose (Year-on-Year Change)