
Toshiyuki Yokoi
Ph.D. in Engineering
Assistant Professor
Chemical Resources Laboratory
Tokyo Institute of Technology
Zeolites1) are porous crystalline materials with a uniform pore size of 0.3-1 nm, which is comparable to that of many molecules (Figures 1 and 2). Thanks to these structural characteristics, zeolites exhibit molecular sieving, ion-exchange, and catalytic functionalities. For crystalline zeolite particles with sizes on the order of micrometers, the outer surface area accounts for no more than a few percent of the total surface area. For this reason, most active sites exist inside the pores. For molecular reactants or reaction products with sizes comparable to the zeolite pore size, the rate and selectivity of reactions are affected by the geometrical relationship between the pores and the shape of the molecules. This property, known as molecular sieving or shape selectivity, is one of the most important characteristics of zeolites. Zeolites are typically aluminum silicates consisting of a silica backbone with isomorphous substitution of Al at some Si sites. In a system containing Si4+ and Al3+, one additional cation is required to maintain the charge balance, which gives rise to an ion-exchange capacity and solid-acid catalytic functionality. At present, zeolite catalysts are used not only for producing chemical raw materials from petroleum, but also for environmental cleaning systems. Zeolites are also considered promising as potential catalysts for synthesis of chemical products through biomass conversion.
Structural analysis of zeolites, particularly their pore structure, can be performed using powder X-ray diffraction (XRD), nitrogen adsorption/desorption measurements, and techniques such as transmission electron microscopy (TEM) and scanning electron microscopy (SEM). Electron microscopy is a particularly powerful tool since it allows direct observation of the pore structure.
In this article, we describe recent achievements in the use of SEM and scanning transmission electron microscopy (STEM) for structural analysis of zeolites, focusing in particular on zeolites with a uniform micropore distribution.
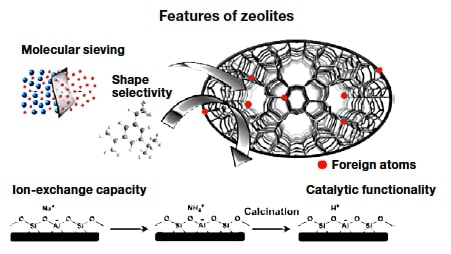
Fig.1 Features of zeolites.
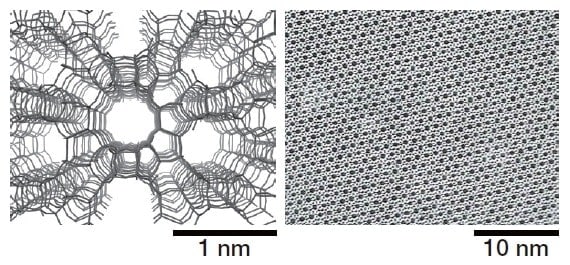
Fig.2 Structural model (left) and TEM image (right) of zeolite.
Powder samples were finely ground in a mortar, added to an ethanol solution, and then highly dispersed by ultrasonic irradiation. Liquid droplets were dropped onto a Cu microgrid, dried, and subjected to SEM and STEM observations. The instrument we used was a SU9000 ultra-high resolution scanning electron microscope (Hitachi High-Tech Corporation). Cross-sectional specimens were prepared by ion milling using an IM4000 system (Hitachi High-Tech Corporation).
Direct observation of zeolite micropores requires high resolution and is generally performed using TEM at acceleration voltages of 200-300 kV. However, zeolites are particularly susceptible to damage and charging by electron beams, so that sophisticated techniques are required to observe them. Because advanced TEM instruments are complicated to use, it is common for researchers to ask expert practitioners to make these measurements for them. In contrast, using the SU9000 in bright-field (BF)-STEM mode allows the pore structure of zeolites to be observed with ease, as in the examples presented here.
Figure 3 shows BF-STEM images of ZSM-5, an MFI-type zeolite. In the image on the left, it can be seen that the pores are aligned in regular arrays, and from the higher-magnification image on the right, the pore size is determined to be approximately 0.5 nm. Because the pore size in MFI zeolites is known to be around 0.55 nm, this demonstrates that BF-STEM is an effective tool for observing pores in such zeolites. Although smaller pores with sizes of around 0.3 nm would be more difficult to observe due to the resolution limit, BF-STEM allows observations of a variety of zeolites with pore sizes of 0.5 nm or larger.
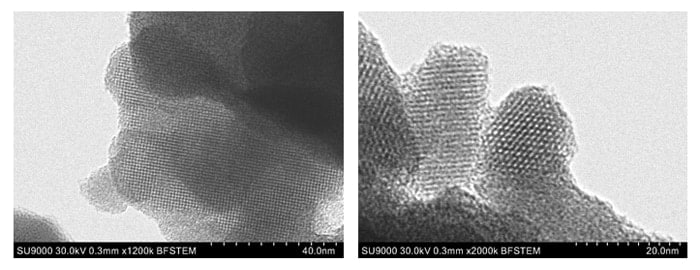
Fig.3 BF-STEM images of ZSM-5 zeolite.
In the catalytic cracking of naphtha, the MTO (methanol to olefins) reaction, and other solid-acid catalytic processes using the Al-containing zeolites, e.g., ZSM-5 and SSZ-13, the activity decreases along with the reaction time. The reasons for this include structural collapse, loss of Al atoms from the zeolite framework, coverage of active sites by coke, and blockage of pores. Solving these problems requires acquiring information about the structure and distribution of active sites and about the sites at which coke forms. An effective approach is to perform detailed observations of the cross-sectional structure of zeolite particles. We used an ion-milling system to perform cross-sectional observations of zeolite catalysts and energy-dispersive X-ray spectroscopy (EDX) to determine the distribution of elements in the interior of the particles. One example is described below.
We used ZSM-5, an MFI zeolite, to perform catalytic cracking of hexane at 650°C. For flow times of 3, 6, and 12h, the volume of coke deposited—as calculated by thermogravimetric (TG) analysis—was 5.3, 6.8, and 8.8 wt%, respectively. In addition, from differential thermal analysis (DTA), the peak heat-generation temperatures were respectively 600, 630, and 640°C, indicating a slight shift toward higher temperature. In other words, as the reaction proceeded, an increasing volume of coke formed on the ZSM-5 catalyst. Moreover, the molecular weight of this carbonaceous material was found to increase, making it less combustible one. Where on the ZSM-5 catalyst is the coke deposited? Is it inside the zeolite pores, or on the outer surface of the particles? To answer this question, we used an ion-milling system to perform cross-sectional structural observations and an EDX composition analysis of zeolite catalysts. Our primary objective was to map the distribution of coke (carbon). However, because the pastes usually used to fix powder samples in place contain carbon themselves, they are not well-suited for this purpose. For this reason, as shown in Fig. 4, samples were held in place by trapping them between copper films.
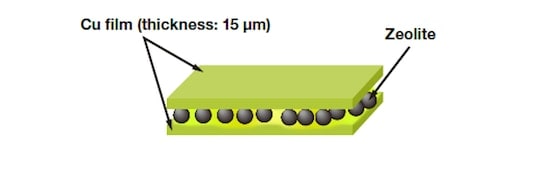
Fig.4 Sample preparation for carbon mapping.
Figure 5 shows cross-sectional carbon-mapping images of the ZSM-5 particle after the reaction time of 3, 6, and 12 h. As the reaction proceeds, it can be seen that coke is produced more along the edges of the crystal than in its interior. Thus, the coke does not exist in the interior of the pores, but mainly on the outer surface or near the pore inlets. A particularly strong carbon signal is detected from the surface to a depth of about 400 nm, and its intensity increases with increasing reaction time. For longer reaction times, coke also forms in the interior of the particle. Thus, by varying the type of catalyst used and the reactions involved, and then investigating the resulting coke distribution, information will be gained that will allow the design of more efficient, longer-lifetime catalysts.
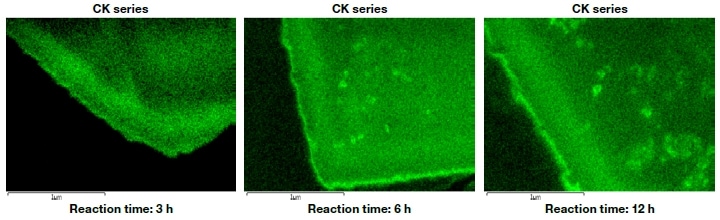
Fig.5 Distribution of coke on ZSM-5 zeolite catalyst after catalytic cracking of hexane.
Most nanoporous materials such as zeolites are insulators, and are particular susceptible to electron-beam damage and charging. For this reason, no accurate surface observations have yet been performed. If the accelerating voltage is increased in an effort to acquire more detailed information, although the resolution increases, primary electrons penetrate the sample, yielding little surface information. A recently-developed family of techniques that has attracted interest is based on low-voltage ultra-high-spatial-resolution SEM, in which the electron beam energy is reduced in order to prevent penetration of the primary electrons in the sample, allowing surface information to be obtained selectively with nanometer-scale spatial resolution.2, 3) Among methods of this sort, the retarding method—in which a negative voltage (the "retarding" voltage) is applied to the sample, causing the electron beam accelerated by the electron gun to be decelerated just before reaching the sample—allows high-resolution observation of sample surfaces. In practice, this method has been extensively applied to research problems, in fields such as electron devices and biomaterials. Here, by applying low-voltage ultra-high-spatial-resolution SEM using the retarding method to the study of zeolites, we obtained information that could not be acquired using existing methods of analysis.
Our samples were the FAU-type zeolites, Y and ultra-stable Y (USY). The two have identical crystal structures, differing only in the Al content. USY zeolite is prepared from Y zeolite by chemically processing it to remove Al (Al removal treatment), yielding a zeolite with a higher hydrothermal stability than Y zeolite. USY zeolite is an important catalyst for petroleum refining, and is widely used in contact cracking processes involving a petroleum fluid bed. Figure 6 shows SEM images of USY zeolite obtained at an accelerating voltage of 1 kV with and without a retarding voltage.
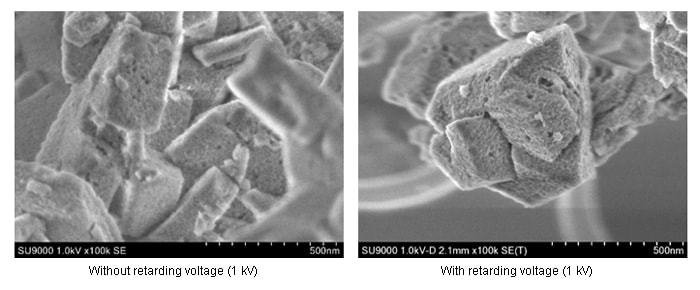
Fig.6 Low-accelerating-voltage SEM observations of commercially available USY zeolite.
It is clear that the use of the retarding voltage allows us to achieve ultra-high spatial resolution. Figure 7 shows retarding-field SEM images of Y-zeolite particles obtained at an accelerating voltage of 1 kV.
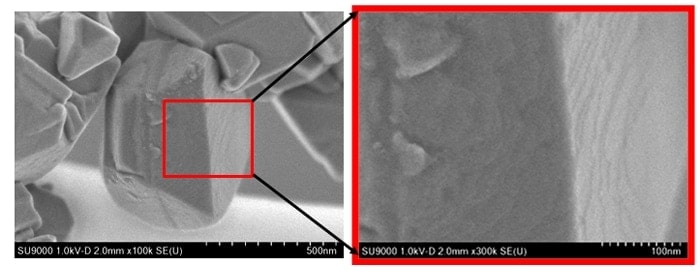
Fig.7 Low-accelerating-voltage SEM observations of commercially available Y-zeolite.
Steps can clearly be observed on the surface, reflecting the crystal structure. Such steps could not be observed using non-retarding methods, and in the past this type of surface information could only be obtained using techniques such as atomic-force microscopy (AFM) or scanning-probe microscopy (SPM).4)
By combining these analytical methods, we can expect to obtain a wider variety of surface information, including information on roughness, morphology, and composition, in addition to reconstructed 3D images. Finally, Figure 8 shows retarding-field SEM images illustrating the differences between Y and USY zeolites. It can clearly be seen that the Al removal treatment leads to the formation of non-crystalline silica regions, in addition to mesopores.
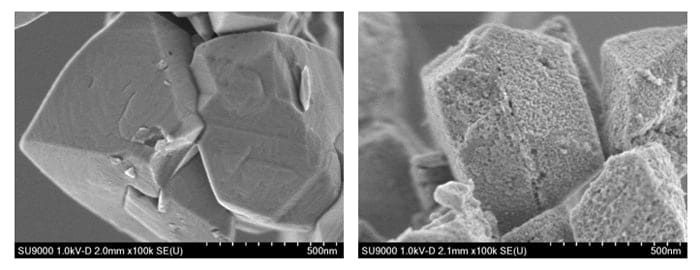
Fig.8 Comparison of commercially available Y and USY zeolites.
In this article we have presented examples of observations of zeolites using the SU9000, an instrument that offers very high performance. By the complementary use of both SEM and STEM, we can identify both the shape of particles and the existence of pores. The SU9000 has therefore become an extremely effective analytical tool in the author's research group. Among the structural analysis goals expected to be achieved by SEM in the future, we anticipate the following.
In TEM and STEM, the normal practice is to search for thin particles to observe. However, because the resulting images are transmission images, they do not yield information on the particle surface. A technique for direct imaging of zeolite particle surfaces, capable of revealing the types of pores that exist on these surfaces, would represent a significant breakthrough. By carrying out such an analysis in conjunction with cross-sectional observations, it would be possible to visualize the distribution of atoms within the zeolite, both on the particle surface and in the interior. This would require considerably higher resolution (on the order of 0.3 nm) than is presently available.
If it were possible to observe lattice images, this could be combined with morphology observations to enable crystal-structure analysis. Electron energy-loss spectroscopy (EELS) allows the chemical state to be analyzed with high energy resolution, and is even capable of analyzing light elements. By performing these analyses in conjunction with EDX, we can expect to obtain more precise information on elemental composition distributions.
If it were possible to introduce non-crystalline gels—the raw material of zeolites—into the sample chamber, and to heat these gels, the crystal-growth process could be observed under hydrothermal conditions. Also, lack of hydrothermal stability is one of the weaknesses of zeolites, and this technique would allow the process of structural degradation in the presence of water vapor to be directly studied. If these advances could be achieved, it may be possible to clarify the as-yet-unknown mechanisms of zeolite crystallization, which would send major ripples throughout the world of zeolite science. In addition, an understanding of crystallization mechanisms could lead to improved methods for introducing active sites, creating entirely new types of zeolites and facilitating the development of higher-performance zeolites.
The field of electron microscopy continues to evolve on a daily basis. We eagerly await the exciting developments that will come in the future.
Acknowledgements
In carrying out the SEM and STEM observations presented here, we received invaluable assistance—not only help with the actual observations, but also general technical guidance—from Yoshihisa Orai and Takeshi Sunaoshi. We extend to them our gratitude.
References
See more
