
Tsuyoshi Ebina
Analysis Group
Planning & Administration Department, Technology Group
JX Nippon Mining and Metals Corporation
In the non-ferrous metal industry, there is significant demand for valence analysis of elements such as arsenic, antimony, and selenium. Co-precipitation with ferrous hydroxide is used to separate and remove arsenic from substances such as factory waste water produced during the copper refining process. However, whereas pentavalent arsenic As(V) is easy to remove, trivalent arsenic As(III) is not. Similarly, whereas quadrivalent selenium can be co-precipitated using ferrous hydroxide, hexavalent selenium can not.
In addition, both the relative concentrations of arsenic and antimony and the valence of the ion species present in copper electrolyte solutions affect the formation of floating slime, which has been reported to degrade the quality of electrolytic copper and to influence its physical properties.
For these reasons, a valence analysis is generally performed for arsenic, antimony, and selenium. However, apart from the case for selenium, which can be co-precipitated with ferrous hydroxide and analyzed using inductively coupled plasma-optical emission spectroscopy (ICP-OES), there are as yet no simple analysis methods for these elements. The methods that are currently used for separation and analysis are highly time-consuming and involve complicated procedures such as solvent extraction and ion-exchange column separation. Given this state of affairs, there is strong demand for simple and rapid analysis methods.
There are some possible candidates, including separation and measurement techniques based on high-performance liquid chromatography (HPLC) with reversed-phase1-4) or ion-exchange columns.5) In the present study, valence-dependence separation was performed using C30 reversed-phase columns, which can be cleaned using organic solvents and are stable over long periods of time. The eluate from the columns was analyzed using hydride generation-atomic absorption spectrophotometry (HG-AAS), which is a well reported technique. 4-7) The equipment required for HPLC/HG-AAS is relatively inexpensive and offers good sensitivity.
Figure 1 shows a schematic diagram of the experimental apparatus. The AAS measurements were performed using a polarized Zeeman atomic absorption spectrophotometer (Z-2310, Hitachi High-Tech Science Corp.) with a quartz cell for heating. The HPLC analysis was carried out using a LaChrom Elite system (Hitachi High-Tech Science Corp.). Two C30-5 columns were used (Wakopak Navi, Wako Pure Chemical Industries, Ltd.), both of which had an inner diameter of 6 mm, but with lengths of 150 and 250 mm, and these were connected in series. The column temperature was 30&°C. The hydride generation tube was a PFA fluorine resin tube with an inner diameter of 2 mm and a length of 6 m. The tube pump was a MINIPLUS 3 (Gilson, Inc.), and the mass-flow controller for the nitrogen carrier gas was a MQV9500 (Yamatake Corp.) with a flow rate of 100 mL/min.
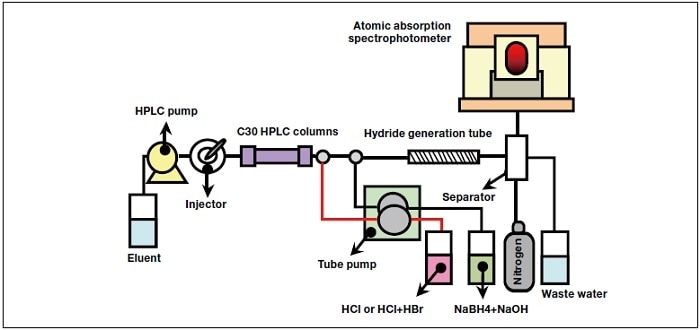
Fig.1 Schematic diagram of experimental apparatus.
The eluent consisted of an aqueous solution of 5 mM tetra-n-butylammonium hydroxide, 2 mM sulfuric acid and 40 mM citric acid. The eluent flow rate was 1 mL/min.
When sample solutions contained no more than 100 mg/L of both copper and chromium, we mixed a 1.2 M HCl acid solution with the eluate from the HPLC columns. Because real samples may contain higher concentrations of metal ions, for the actual experiments, we used an acid solution of 6 M HCl and 1.8 M HBr to reduce the effect of metal ions. The sodium tetrahydroborate solution was a mixture of 1.5 (w/v)% sodium tetrahydroborate and 0.4 (w/v)% sodium hydroxide.
To prepare As(III) standard solutions, 10 mL of a commercial 1,000 mg/L arsenic standard solution was mixed with 10 mL of a mixture of 40 g/L L-ascorbic acid and 200 g/L potassium iodide, and 8 mL of concentrated HCl, and the final solution was diluted to 100 mL. A similar procedure was used to prepare 10 mg/L and 1 mg/L solutions.
To prepare As(V) standard solutions, the following procedure was used. 10 mL of a commercial 1,000 mg/L arsenic standard solution was added to 5 mL of a sodium hypochlorite solution and 5 mL of concentrated nitric acid, and diluted to 100 mL to obtain a 100 mg/L solution. To 10 mL of this solution, 2 mL of concentrated nitric acid was added, followed by dilution to 100 mL to prepare a 10 mg/L solution. In a similar manner, a 1 mg/L solution was prepared.
We first investigated the effect of the eluent composition on the relative retention times for As(III) and As(V).
Figure 2 shows the As(V) retention time for eluents containing quaternary ammonium ions with different numbers of carbon atoms. For tetramethylammonium (TMeA), the As(V) peak appears before the As(III) peak, whereas the reverse is true for tetraethylammonium (TEtA), tetra-n-propylammonium (TnPrA), and tetra-n-butylammonium (TnBtA). Since the greatest difference in retention time is seen for TnBtA, as was also reported by Le and Ma,6) this was the eluent used in the present study.
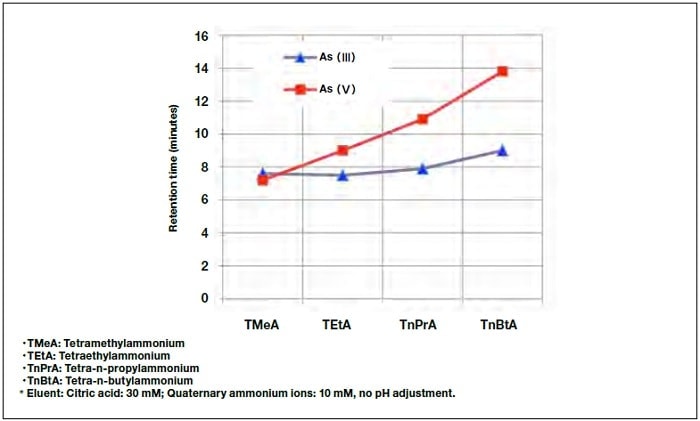
Fig.2 Dependence of retention time on quaternary ammonium ion species in eluent.
Figure 3 shows chromatograms for As(III) and As(V) obtained under standard HPLC-HG-AAS measurement conditions. Here, the arsenic concentration was 2.8 mg/L. Although the retention time for As(V) is longer than that for As(III), and the peaks are clearly resolved, the peak for As(V) is higher and slightly narrower than that for As(III). The difference in retention time of approximately 4 minutes is sufficient to determine the concentration of both As(III) and As(V).
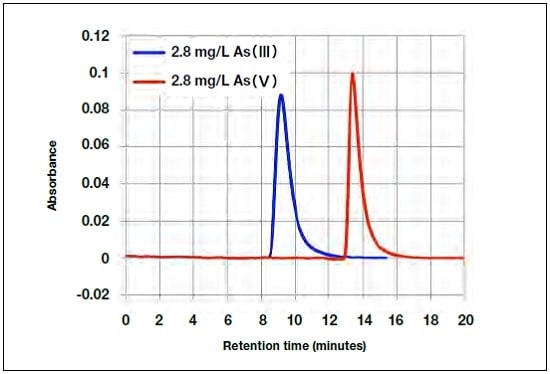
Fig.3 As(III) and As(V) chromatograms.
The efficiency of hydride generation for As(V) is typically reported to be about 40-60% that for As(III). For this reason, when using a method such as HG-AAS to determine the overall arsenic content, a pre-processing step must be performed to chemically reduce As(V) to yield As(III).9)
However, in the HPLC-based valence-dependent arsenic separation method for generating hydrides, it is not possible to perform this preliminary reduction step. For this reason, we investigated the possibility of improving the hydride generation efficiency for As(V) by varying the length of the hydride generation tube and the concentration of the citric acid and tartaric acid.
In this investigation, we use a resistance tube instead of C30 columns in order to make the As(III) and As(V) peak shapes similar, and the flow-injection analysis (FIA) method was employed. Because with the HG-AAS technique, there is a nonlinear relation between the arsenic signal intensity and the gaseous arsenic concentration in the quartz cell at high arsenic concentrations, it is important for the peak shapes to be essentially identical in order to allow direct comparison of the area under the peaks.
For this reason also, TnBtA was not added to the transport fluid used in the FIA method, since this would lead to As(V) being retained for slightly longer and the peak shape being changed.
With an inner diameter of 2 mm and a length of 2 m for the hydride generation tube, we obtained a hydride generation efficiency of close to 90% for As(V). Further extending the length of the tube yielded an efficiency of 97% in the range 3-6 m. Based on these results, we set the length at 6 m to ensure a comfortable margin.
Figure 4 shows the dependence of the peak area for As(III) and As(V) on the concentration of citric or tartaric acid in the transport fluid. Here, the mean peak area for As(III) is taken to be 100%. It can be seen that for both types of acid, the hydride generation efficiency for As(V) increases with acid concentration. However, since it was found that for As(V), significant tailing of the peak occurred during HPLC analysis for acid concentrations above 40 mM, the concentration of citric or tartaric acid was set at 40 mM.
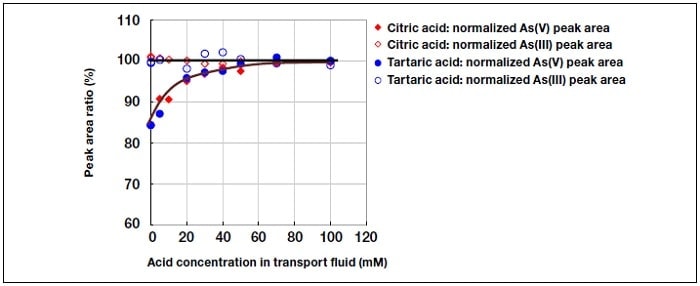
Fig.4 Effect of acid concentration.
When analyzing arsenic via hydride generation, it is known that the presence of copper, nickel, or other metal ions can reduce the accuracy of the results.8,9) We therefore investigated the separation of Cu, Ni, Fe, Co, and Cr during HPLC analysis of As(III) and As(V).
We found that these metal ions appeared before As(III), demonstrating successful separation from arsenic. Figure 5 shows the dependence of the peak area for As(III) and As(V) on the number of injections in the case where 5 g/L of Cu(II) ions is present in the sample solution. All values are normalized by the peak area for a single injection of 6 M HCl + 1.8 M HBr as the hydride generation acid, which corresponds to 100%. It can be seen that when the acid used is 1.2 M HCl, the peak area decreases significantly from the first injection, and the effect becomes larger with increasing number of injections. This also occurs for 6M HCl, although the decrease is smaller. In the case of 6 M HCl + 1.8 M HBr, no significant drop occurs until the third injection.
For this reason also, TnBtA was not added to the transport fluid used in the FIA method, since this would lead to As(V) being retained for slightly longer and the peak shape being changed.
Thus, although copper and arsenic can be successfully separated, the process becomes less efficient, and this effect is cumulative. In cases where such a decrease in hydride generation efficiency occurred, tubes to which sodium tetrahydroborate was added turned black due to the deposition of sediment. We take this as evidence that the sediment preferentially dissociates sodium tetrahydroborate, resulting in reduced hydride generation efficiency of arsenic.
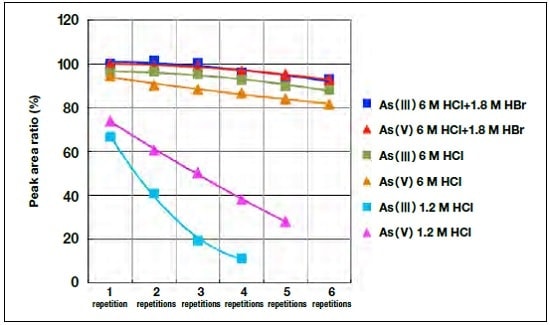
Fig.5 Decrease in sensitivity with repeated injections of sample substance containing high concentration of copper.
Next, for the case in which Cu, Ni, Fe, Co, and Cr are present in the sample, we examined the range of allowed concentrations required to ensure that the mean yield after 5 measurements lay in the range 97% to 103%. When the hydride generating acid was 6 M HCl + 1.8 M HBr, the allowed range was up to 3 g/L for Cu(II), Ni(III), Fe(II), Fe(III), and Co(II), as well as up to 3 g/L Cr(III) for As(III). For As(V), the allowed range was up to 1 g/L Cr(III).
Figure 6 shows the measured peak area as a function of the arsenic concentration, before and after the improvements to the hydride generation efficiency for As(V) described in Section 4. It can be seen that the optimized citric acid concentration and hydrogenation tube length improve the detection sensitivity for As(V) almost to that for As(III). Figure 7 compares the total arsenic concentration measured using both HPLC/HG-AAS and ICP-OES for the approximately 100 samples we have measured so far, including the results for the conditions of the present study. When the sample solution was diluted and injected into the HPLC system, the ranges were 0 to 0.55 g/L for Cu, 0 to 0.1 M for sulfuric acid, and 0 to 0.27 g/L for Fe.
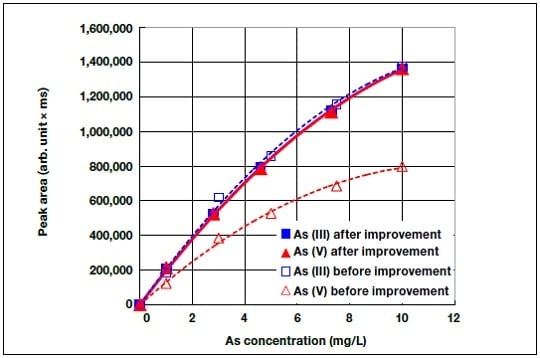
Fig.6 Experimentally determined As(V) hydride generation efficiency before and after improvement.
As shown in Figure 7, the combined As(III) and As(V) concentrations measured by HPLC/HG-AAS and ICP-OES are in good agreement. A similar comparison was performed for a sample containing only As(V), and good agreement was again found. It can therefore be concluded that the method proposed in the present study is ready to be used in practice.
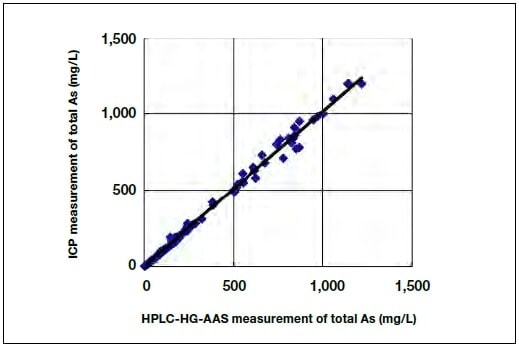
Fig.7 Combined As(III) and As(V) concentrations measured by HPLC/HG-AAS and ICP.
For the separation and analysis of As(III) and As(V) by HPLC/HG-AAS, the effect of the eluent composition and the concentration of the acid used to generate hydrides was investigated. Based on the results, a method was developed for performing stable measurements over long periods of time, even for samples containing high concentrations of sulfuric acid, copper, or organic decomposition products, which are commonly encountered in the non-ferrous refining industry.
In addition, by adding an oxycarboxylic acid such as citric acid to the HPLC eluent, and by optimizing the hydrogenation tube and the concentration of sodium tetrahydroborate, the sensitivity for As(V) detection was increased to about 98-100% of that for As(III), compared to the original value of around 40-60%.
In view of these accomplishments, we believe that we have developed an analytical method with improved quantitative accuracy for As(V) evaluation.
References
Acknowledgements
This work was completed with assistance from Hideyuki Sakamoto and Toshihiro Shirasaki of Hitachi High-Tech Science and from Hiroshi Kashimura and Kenichi Kamimura of JX Nippon Mining and Metals Corporation. We extend to them our gratitude.
See more
