
Yuki Kimura
PhD (science)
Associate Professor
Institute of Low-Temperature Science
Hokkaido University
The transmission electron microscope (TEM), developed in 1931 by Ruska and collaborators at the Technical University of Berlin, succeeded in bringing to life some of the oldest dreams of scientists: to observe ever-tinier bodies and to obtain ever-more detailed information. This progress served only to whet appetites for further advances: to observe dynamical processes directly and track their evolution in time and to observe samples under environments closer to the real world. The former was realized by the introduction of heated and cooled sample holders, and the advancement of camera technologies in recent years has made it possible to capture phenomena at high speeds without sacrificing imaging resolution. The latter was made possible by the development of methods for introducing gases into TEM instruments, of which the Kamino holder is a characteristic example; in 2003, Williamson et al. succeeded in introducing solution into a TEM using a homemade cell1) . In general, TEM observations involve the transmission of an electron beam, and thus require that samples be thinned to thicknesses on the order of 100 nm and that the interior of the instrument be maintained at high vacuum. The sample chamber is also subject to strong magnetic fields and limitations on spatial extent, making it difficult to introduce complex structures. To address these restrictions, Williamson et al. used thin films to introduce solution into a TEM, and successfully observed the solution interior via electron-beam irradiation.
Thereafter, as solution holders became commercially available from the U.S. companies Protochips and Hummingbird Scientific, our field experienced a worldwide explosion of interest in research involving TEM observations of crystallization processes in solution, resulting in breakthrough discoveries including microcrystal growth processes that proceed via oriented attachment2) and emergence of non-crystalline particles before crystallization of calcium carbonate3) . In addition, increasingly common reports of observations of biological samples such as ribosomes and rotaviruses testify to the ongoing broadening of this active area of research4) . For biological samples in particular—for which TEM observation traditionally required freezing or staining—the availability of solution TEM has developed into a powerful tool for characterizing the sizes and shapes of samples in their natural environments. As the powerful capabilities of TEM instruments become applicable to samples in solution, we can expect new breakthroughs in a huge number of fields—from materials science, to self-organization, electrochemistry and catalytic reaction, nanoparticle growth, fluid physics, radiation physics, geological and environmental specimens including clay and aerosol samples, complex biomaterials and polymers, biology, drug discovery, foodstuffs, paints, cosmetics, and more. Indeed, even just within our research group we have observed a wide range of samples—from metal nanoparticles to photocatalyst particles, colloidal particles, salts, proteins, clay minerals, cement, ribosomes, and E. coli bacteria—and we are thoroughly convinced of the great promise and potential of solution TEM5-8) .
At present, solution holders are also commercially available from the Dutch firm DENS solutions B.V., and a product known as the K-kit (Materials Analysis Technology Inc.), which allows the use of existing holders, has also appeared. Developments such as these contribute to facilitating applications of solution TEM. In 2012, we inserted a solution holder from Protochips into a Hitachi H-8100 TEM—with accelerating voltage 200 keV and an LB6 filament—and proceeded by trial and error to establish an experimental procedure—which we call fluid-reaction TEM—all the while maintaining an exchange of information and ideas with Protochips. Thus, in this report we discuss the Protochips solution holder known as the Poseidon. In particular, we take pains to include as much relevant information as possible for the benefit of those contemplating the adoption of solution holders for TEM observations.
The introduction of solution into the vacuum environment of the TEM is made possible by injecting and sealing the solution in the space between two windowed silicon slabs (the E-chips product from Protochips), as shown in Figure 1. The windowed slabs have notches near their centers and are equipped with amorphous silicon nitride thin films of thickness 30-50 nm that serve as windows. The small (2.0 × 2.0 × 0.3 mm) windowed slabs—which come in various types with names like static or flow—are equipped with spacers (gold-colored regions in Figure 1B). By selecting the thickness of these spacers appropriately, one can prepare solution samples of varying thickness, ranging from 50 nm to 5 µm. We typically use spacers of 150 nm or of 500 nm depending on the relationship between contrast and sample number density. The electron beam passes through this window to allow observation of the solution. In addition, the use of flow E-chips, which feature spacers resembling support pillars in the four corners of the slab, allows advanced techniques such as mixing of two solutions under TEM observation or flowing of different solutions to adjust reaction conditions. The microwell variety of E-chips include multiple well-like regions bored near the center of the window. In this case, there are no spacers, and the solution is injected directly into these wells for observation. Because the thin films of amorphous silicon nitride are only present at the bottom of the wells in this configuration, swelling of solution layers due to the TEM vacuum is reduced, allowing images of greater clarity to be obtained. In addition, by using a large (6.0 × 4.5 × 0.3 mm) windowed slab as a heater, the temperature may be controlled from room temperature to 100°C. The solution is isolated from the TEM vacuum by a specially-shaped gasket. In view of the need to withstand pharmaceutical products, the gasket is made from viton, EPDM, or perfluoroelastomer, with the specific choice depending on the sample. The most recent versions of the Poseidon holder may also be used for energy-dispersive X-ray analysis (EDS) by using the sample-tilting capabilities of the TEM.
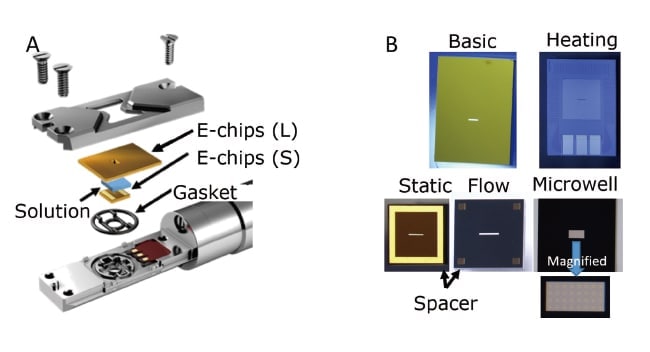
Fig. 1 (A) Schematic diagram of the tip of the heater-equipped solution holder made by the U.S. company Protochips (product name: Poseidon). (B) Optical micrograph of an E-chip silicon slab with a window made by a thin film of amorphous silicon nitride.
The larger and smaller windowed slabs come in several varieties, with the appropriate choice dictated by the application in question. At present, over 400 combinations are possible. Observation of the interior of solutions is possible by passing the electron beam through this window.
Newly purchased E-chips are affixed with a protective membrane covering the amorphous silicon nitride thin film. Thus, the first step is to clean the sample with acetone and methanol, then dry it with a blower. Then, the E-chip is subjected to a hydrophilic treatment (Figure 2) to allow uniform application of solution to its surface and ensure a smooth flow of solution. For aqueous solutions, this yields excellent wetting, as shown in Figure 2C. For cases involving non-polar solvents or similar cases, the windowed slab may also be subjected to hydrophobic treatment by heating for 1.5 hours at 150°C.
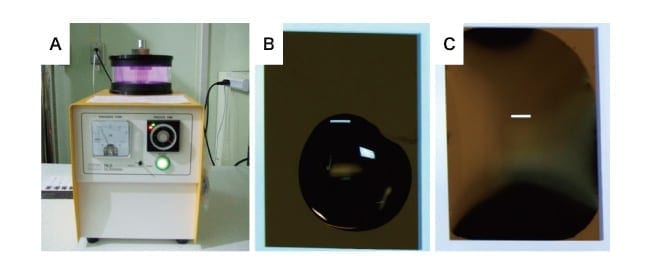
Fig. 2 (A) Hydrophilic treatment applied before assembling the solution cell. (B,C) Result of dripping equal amounts of water for 30 seconds on E-chips before (B) and after (C) hydrophilic treatment. The hydrophilic treatment ensures uniform wetting of the windowed slab.
Figure 3 shows stereo microscope images of the solution cell assembly process. The smaller windowed slab is mounted (Figure 3B) atop the specially-shaped gasket (Figure 3A) and 0.5 - 1 µL of solution is dripped onto the slab (Figure 3C). The larger windowed slab is then placed on top of the solution layer (Figure 3D) and covered with a titanium lid, which is fixed in place by screws turned with controlled torque (Figure 3E). This results in a 50 × 50 µm observation region, visible as the bright region in the center of Figure 3F (in which the cell has been rotated 90 degrees). If the window ruptures or contaminants are trapped in the cell, this can be immediately detected via enlarged stereo microscope images, in which nonuniformities in the window will give rise to interference fringes. The total volume of solution is on the order of 2 nL for 500 nm spacers.
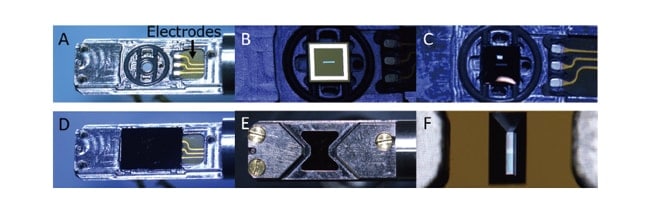
Fig. 3 Procedure for assembling a solution cell for the Poseidon holder.
To avoid dispersing solution through the interior of the TEM, one must always check for leaks before commencing observations (Figure 4A). However, even if solution leaks from the cell into the TEM, the vacuum gauge barely registers any disturbance, and—as long as one is not using a flow cell to achieve a continuous flow of solution—the impact on the TEM itself is likely to be limited. To flow solution, a syringe pump is connected through a PEEK tube of inner diameter 100 µm. Waste liquid is discharged into a beaker or similar vessel through a PEEK tube of inner diameter 150 µm. Figure 5 shows a low-magnification TEM image of the observation window region of the solution cell. Note the bright regions visible in the four corners; these are due to stretching of the amorphous silicon nitride film by the TEM vacuum, and the effect is more pronounced near the center. For this reason, observations are typically centered at one of the four corners.
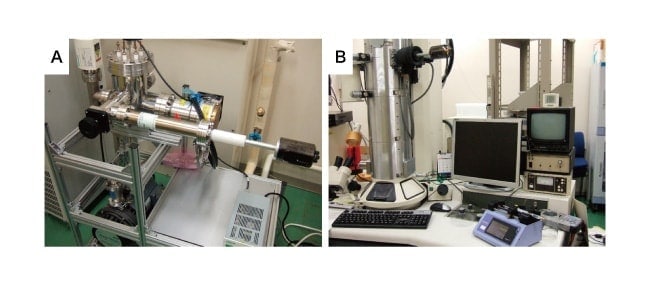
Fig. 4 (A) Checking for leaks immediately before an observation. (B) When installed in TEM. To flow solution, a syringe pump is connected through a PEEK tube.
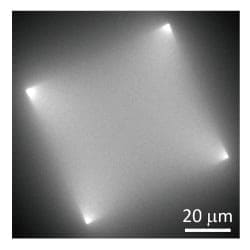
Fig. 5 Low-magnification TEM image of the observation window region of a solution cell.
Figure 6 shows a process in which water is replaced by a colloidal gold solution. We use flow E-chips with 150 nm spacers and flow colloidal gold solution at a rate of 2 µL min-1; this allows observation of the process of water being gradually replaced by colloidal gold solution. At that time, we use the three distinct contrast regions prominently visible in Figure 6B and C, moving each from upper right to lower left at identical speeds (~40 nm s-1). The differences between the three contrast values may be attributed to the effects of the meniscus (Figure 6D). Zooming in on the colloidal gold solution allows gold nanoparticles to be observed. This may sound obvious, but in fact an estimate of the velocity of Brownian motion of gold nanoparticles in water shows that particles could easily move between edges of the field of view during the camera exposure time. The fact that observations are possible nonetheless demonstrates that the diffusion rate (velocity of motion) of nanoparticles in a thin water layer is vastly smaller than that predicted for the bulk liquid. Indeed, the discrepancy may be as large as 7-9 orders of magnitude. This cannot be explained on the basis of calculations of the diffusion of water-suspended nanoparticles in pores. Yet, this enormous attenuation of diffusive motion is precisely what makes it possible for us to carry out in-situ observations of nanoparticles in solution.
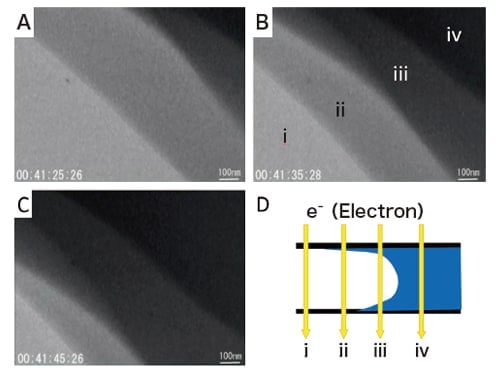
Fig. 6 Process by which water, existing in the weak-contrast region near the lower left in panel A, is gradually replaced by a colloidal gold solution flowing into the cell from the upper right. The 4-stage gradation of contrast variations, visible in panel B, may be attributed to effects of the meniscus formed at the interface between water and colloidal gold solution, as shown in panel D. For this observation, a flow E-chip with 150 nm spacers was used as the smaller windowed slab; colloidal gold solution was flowed at a flow rate of 2 µL min-1.
As one example of our research, Figure 7 presents a simplified version of the initial stages of concrete forming, achieved using a Ca(OH)2 solution and silica particles, which are used to prevent degradation of concrete5) . Observations of silica particles in the presence of a 1 µL min-1 flow of Ca(OH)2 solution reveals significant expansion of the silica particles due to hydration. An analysis of integrated values of the contrast for each individual silica particle reveals that the silica particles dissolve slightly as they expand. Thereafter, calcium silicate hydrates (CaO·2SiO2·4H2O, known as C-S-H) are produced (Figure 7D). From our observations, we learn that, prior to the formation of C-S-H, the expansion of the silica particles results in a filling of the pores in the concrete; thereafter, the formation of C-S-H serves to establish interlinkages between particles, advancing the hardening process. The typical velocity of silica particle expansion was around 3 × 10⁻² nm s-1. Thus, this experiment involving a solution cell allows determination the minuscule rates of hydration-induced expansion, dissolution, and growth of individual nanoparticles—quantities that would be essentially impossible to determine by any other method.
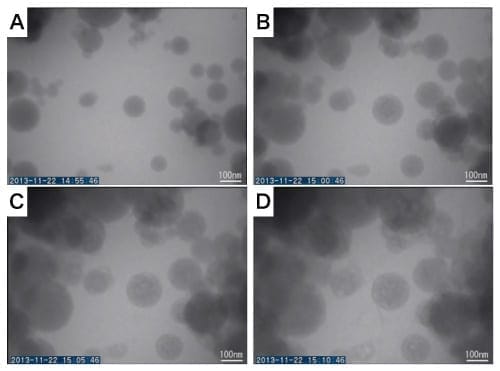
Fig. 7 Results of in-situ TEM observations of an experiment mimicking the process of hydration and cement reactions by sealing amorphous silica particles in a solution cell and subjecting them to a flow of Ca(OH)2.
The smaller windowed slab is a flow E-chip with 500 nm spacers; Ca(OH)2 solution was flowed at a rate of 1 µL min-1.
After a typical observation, one uses a stereo microscope to check whether or not the thin-film windows were in a proper state. Then, the assembly procedure shown in Figure 3 is reversed to disassemble the cell. In cases where solution was flowed to observe formation processes of substances, it is important to prevent the formation of deposits inside the PEEK tube, which can cause blockage. Once a deposit has formed, it is not easy to dissolve, even if the substance is not insoluble. After experiments involving solution flow, it is important to establish a flow of ultra-pure water for a long period of time to suppress deposits of solid matter due to drying. However, the most recent versions of the Poseidon holder allow users to replace the PEEK tube inside the holder themselves; this relaxes the need for concern as compared with earlier versions of the product, allowing more challenging experiments.
When we first began using Poseidon holders, we attempted cleaning E-chips after use with several methods. However, these inevitably involved complications—for example, ultrasonic cleaning has the effect of immediately rupturing the observation window due to its extreme thinness—and we ultimately concluded that reusing E-chips is too difficult, whereupon we now treat all E-chips as single-use disposables. This protocol is made tolerable by advances in MEMS technology, which have enabled a wide variety of solution cells and have lowered costs as well.
It has been almost 15 years since the arrival of the TEM solution cell. Although reports of observations of solution samples remain a rarity within the Japanese Society of Microscopy, in the past few years the field has blossomed into an active field of interest among microscopy societies in other nations, with even special sessions now devoted to solution-sample observations. However, a surprisingly large number of presentations show observed results of a sample in a solution with a limited discussion. On the other hand, some groups have begun in earnest to address the single greatest challenge facing the field today: the problem of electron-beam damage. For example, an observation made with a TEM of accelerating voltage 300 keV and beam current of 1 nA over a region of radius of 1 µm corresponds9) to an absorbed radiation dose per unit time of some 7.5 × 10⁷ Gy s-1. This is 7 orders of magnitude greater than the dose delivered by typical radiation sources. Thorough and careful assessment of the effects of electron beams is a crucial requirement for the future of solution TEM. In the future, we hope that advances in the understanding of electron-beam effects will allow the construction of systems that are easier to characterize—a development that will surely spur dramatic new breakthroughs in the disparate fields of research we noted above.
References
See more
