
Ryuji Uchida
Ph.D. (Pharmaceutical Sciences)
Professor
Department of Natural Product Chemistry
Faculty of Pharmaceutical Sciences
Tohoku Medical and Pharmaceutical University
Secondary metabolites synthesized by, among others, microbes (notably actinomycetes and filamentous fungi), herbs and other plants, and marine organisms are generally referred to as natural products. They have been the sources of various pharmaceutical products, including antibiotics, anticancer agents, immunosuppressants, and antiparasitics. Therefore, natural products have greatly contributed to the advancement of medical care and the welfare of mankind. According to a report by Newman and Cragg1), approximately 60% of currently approved small-molecule drugs possess a core structure (pharmacophore) of a natural product or a natural product mimic. Thus, natural products still serve as important seeds in the development of new drugs. However, during the early stages of drug discovery, it is difficult to determine whether cultures or crude extracts of certain organisms potentially contain chemical compounds with novel structures or bioactive substances with useful properties. This poses a special challenge to scientists working in the field of natural product-based drug research. One of the strategies to address this problem is to conduct exploratory studies. Recent methodologies for these studies include molecular networking analysis2) and comprehensive metabolite profiling with LC-MS or LC-MS/MS. A novel concept for selecting potentially valuable organisms is the use of fluorescent fingerprint measurements. This approach was proposed by Dr. Takashi Fukuda at Kindai University and was described in his article published in this journal (Vol. 10)3). Fluorescent fingerprint measurements have been used in the field of food science for quality assessment (such as detecting contaminants and identifying places of production). It allows for the rapid detection of fluorescent substances even in samples containing many different compounds, without the need for extensive sample pretreatment.
Using fluorescent fingerprint measurements, Fukuda's group previously conducted a principal component analysis of marine microbial cultures. We also carried out a hierarchical cluster analysis of LC-DAD-MSD data collected from the same cultures. Here, I report novel findings discovered by performing the integrative analysis (hybrid analysis) of these two different types of datasets.
Sea mud and marine organism samples were collected from the ocean environments of the East China Sea, the Seto Inland Sea, and the Japanese island of Tanegashima. Marine actinomycetes and other bacteria (a total of 48 strains) were isolated from these samples and used as test bacteria. For the details of the isolation procedures, refer to the article published in this journal (Vol. 10, pages 11-17, 2018)3).
Forty-eight bacterial isolates (strain numbers: 153 - 200) were grown in the following two different media: M1(+) medium (1.0% Soluble starch, 0.4% Bacto™ Yeast extract, 0.2% Bacto™ Peptone, 0.1% CaCO3, 0.01% KBr, and 0.004% Fe2(SO4)3·7H2O in natural seawater) and M1(-) medium [the same as M1(+) but prepared with distilled water]. Each bacterial strain was inoculated into two 100 mL Erlenmeyer flasks containing 25 mL of either M1(+) or M1(-) medium. Following incubation in a rotary shaker (27°C, 160 rpm) for 14 days, 25 mL of ethanol was added to each flask and the mixtures were shaken for one hour to obtain bacterial extracts (a total of 96 samples; referred to as culture samples in this article).
A portion (1 mL) of the clear upper layer of each bacterial extract was transferred to a microtube and centrifuged for 15 min at 10,000 rpm. Subsequently, the supernatant (300 µL) was filtered with a Minisart RC4 membrane (Sartorius Japan K.K.) and used as an assay sample for LC-DAD-MSD analysis.
Mass chromatograms (m/z: 200 - 1,000) and UV-visible absorption spectra (200 - 500 nm) were acquired using the instrument shown in Figure 1. Three-dimensional fluorescence spectra were obtained with the spectrophotometer shown in Figure 2 by monitoring fluorescence intensity while simultaneously scanning both the excitation (200 - 600 nm) and emission (200 - 600 nm) wavelengths.
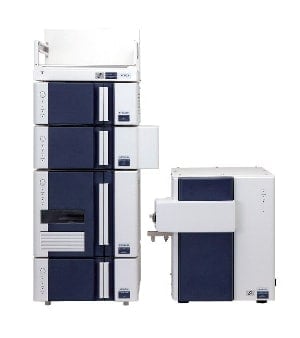
Fig. 1 High-Performance Liquid Chromatograph Chromaster®
Instrument 1: High-Performance Liquid Chromatograph Chromaster®
Analytical Conditions:
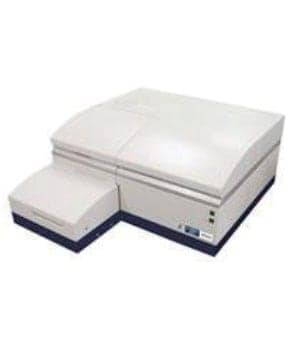
Fig. 2 Fluorescence Spectrophotometer F-7100
Instrument 2: Fluorescence Spectrophotometer F-7100 (EEM® Auto System)
These analyses were performed using the multivariate analysis software 3D SpectAlyze™ (Dynacom Co., Ltd.).
Hierarchical cluster analysis was performed with the 3D SpectAlyze™ using three-dimensional LC-DAD data (absorption wavelength, absorbance, and retention time). The results shown in Figure 3 demonstrate that culture samples were randomly distributed across multiple clusters, irrespective of the presence [M1(+)] or absence [M1(-)] of seawater in the growth media.
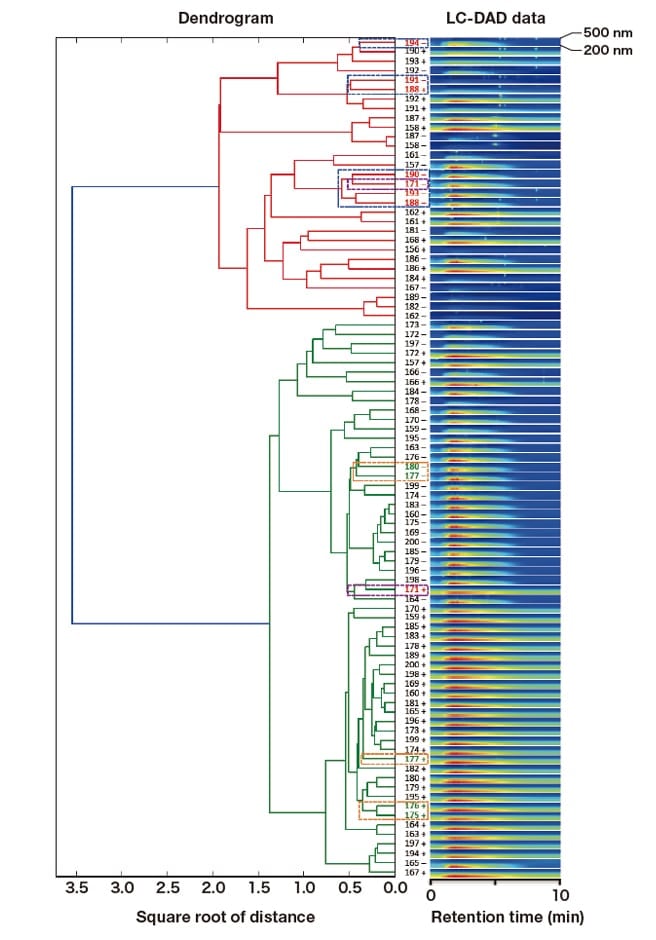
Fig. 3 Hierarchical cluster analysis of LC-DAD data
Similar to Section 3-1, hierarchical cluster analysis was performed using three-dimensional LC-MSD data (molecular mass: m/z, intensity, and retention time). The result is shown in Figure 4. Unlike the result obtained with LC-DAD data, one main cluster (shown in red) consisted primarily of culture samples prepared with M1(+) medium, and the other (green) contained only samples prepared with M1(-) medium (Figure 4). More precisely, only the culture samples 158(-), 165(-), and 187(-) prepared with M1(-) medium were placed within the main cluster of samples prepared with M1(+) medium (Figure 4, purple dashed boxes). It was shown that among these three, 158(-) and 187(-) formed a subcluster with 158(+) and 187(+) prepared with M1(+) medium (Figure 4, green dashed box). Based on these observations, we concluded that the following five culture samples have unique features that distinguish them from the rest: 158(+), 158(-), 165(-), 187(+), and 187(-).
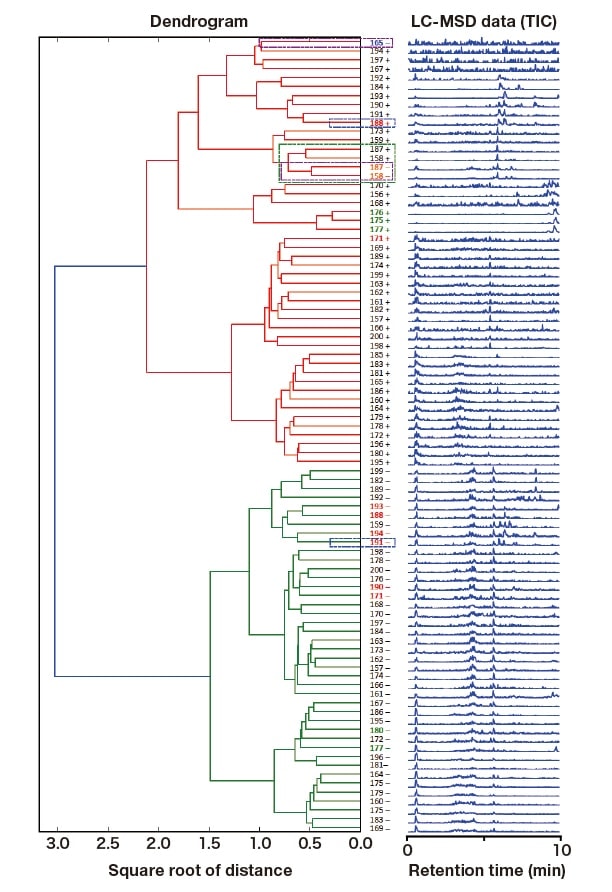
Fig. 4 Hierarchical cluster analysis of LC-MSD data (TIC)
Figure 5 shows the result of principal component analysis of data obtained with fluorescent fingerprint measurements3). Many culture samples were plotted close to the center of the figure. However, the following samples (placed in a red box) showed strong fluorescence intensity between 390 and 400 nm: 171(+), 171(-), 188(+), 188(-), 190(-), 191(-), 193(-), and 194(-). It should be noted that culture samples produced by strains 171 and 188 all belonged to this group, regardless of the presence or absence of seawater in the growth media. Similarly, the following samples (placed in a green box) emitted strong fluorescence at or above 430 nm: 175(+), 176(+), 177(+), 177(-), and 180(-). Here, only strain 177 produced two culture samples that were jointly categorized in this group, irrespective of the use of seawater in the growth media.
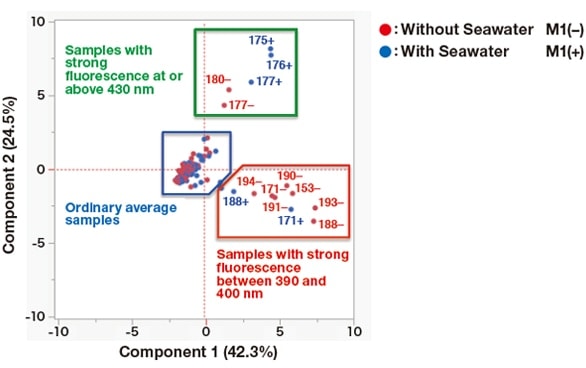
Fig. 5 Principal component analysis of data obtained with fluorescent fingerprint measurements
We performed a hybrid analysis of integrated datasets, each of which was obtained with one of the analytical instruments described above. Here, I show the unique characteristics of select culture samples identified by this analysis. We first combined and analyzed two datasets obtained with fluorescent fingerprint measurements and LC-DAD. In the fluorescent fingerprint measurements, culture samples 171(+) and 171(-) were categorized into the same group (the red box in Figure 5 containing samples with strong fluorescence between 390 and 400 nm), regardless of the presence or absence of seawater in the growth media. However, in the hierarchical cluster analysis of LC-DAD data, 171(+) and 171(-) were placed into two different main clusters shown in green and red lines, respectively (Figure 3, purple dashed boxes). Apart from 171(+), all other samples included in the red box in Figure 5 were found within the main cluster shown in red lines. [As shown in Figure 3 (blue dashed boxes), these samples were classified into the following three subgroups: ① 194(-), ② 191(-) and 188(+), and ③ 190(-), 171(-), 193(-), and 188(-).] Only 171(+) belonged to the main cluster shown in green lines. Thus, 171(+) likely has distinct characteristics not found among any other samples in the red box in Figure 5.
Conversely, samples plotted within the green box (i.e., cultures with strong fluorescence at or above 430 nm) in the fluorescent fingerprint measurements (Figure 5) were all placed into the main cluster shown in green lines (Figure 3). These samples were classified into the following three subgroups (Figure 3, orange dashed boxes): ① 175(+) and 176(+), ② 177(+), and ③ 177(-) and 180(-).
Next, the results described above were integrated into the hierarchical cluster analysis of LC-MSD data. Culture samples 171(-), 188(-), 190(-), and 193(-) were classified into the same group in the hybrid analysis of datasets obtained with fluorescent fingerprint measurements (the red box in Figure 5) and LC-DAD. In the hierarchical cluster analysis of LC-MSD data, these samples were divided into the following two subclusters (Figure 6, blue dashed boxes): ① 171(-) and 190(-), and ② 188(-) and 193(-). Conversely, culture samples 191(-) and 194(-), which were somewhat distantly related to each other in LC-DAD analysis, were placed within the same cluster in LC-MSD analysis (Figure 6, orange dashed boxes). Furthermore, these samples were located close to the cluster containing 188(-) and 193(-). In LC-DAD analysis, culture sample 188(+) formed a subcluster with 191(-) (Figure 3, blue dashed box). However, these two samples were placed in two different main clusters in LC-MSD analysis (Figure 4, blue dashed boxes). Thus, the culture samples that belonged to a single group in the fluorescent fingerprint measurements were divided into three subgroups by this hybrid analysis.
Culture samples 177(-) and 180(-) were closely related to each other in the hybrid analysis of datasets obtained with fluorescent fingerprint measurements (the green box in Figure 5) and LC-DAD. These samples also fell into closely linked clusters in LC-MSD analysis (Figure 7, blue dashed boxes). Similarly, culture samples 175(+), 176(+), and 177(+) were placed in the same cluster in LC-MSD analysis. In LC-DAD analysis, however, 177(+) was situated at a slight distance from the other two samples (Figure 7, orange dashed boxes). Therefore, these samples were also subdivided into three groups.
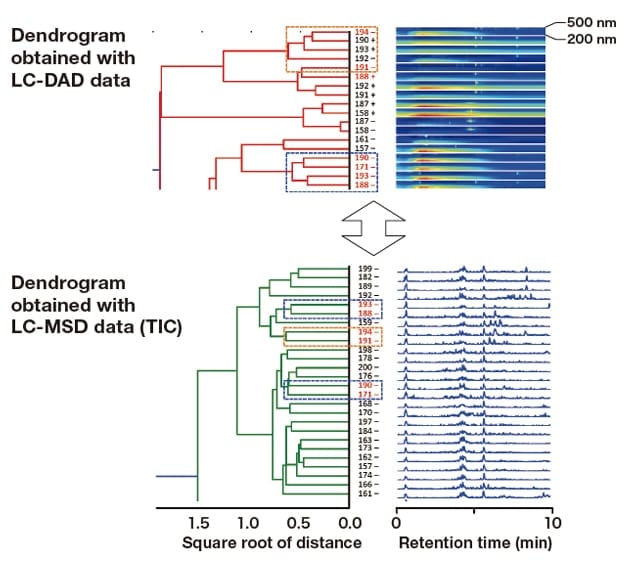
Fig. 6 Comparison of dendrograms generated for culture samples with strong fluorescence between 390 and 400 nm: LC-DAD and LC-MSD (TIC) datasets
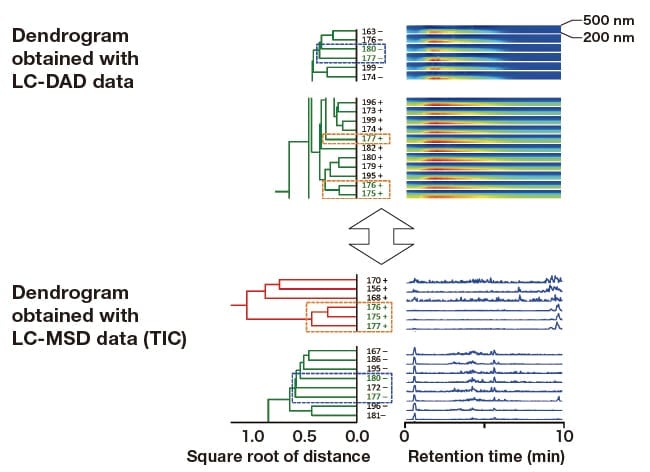
Fig. 7 Comparison of dendrograms generated for culture samples with strong fluorescence at or above 430 nm: LC-DAD and LCMSD (TIC) datasets
When examined by cluster analysis or principal component analysis, one can identify culture samples with special characteristics even from a single dataset obtained with one of the analytical techniques described above. For example, as discussed in the previous section, we were able to recognize the potential uniqueness of culture samples 158(-) and 187(-) solely from LC-MSD analysis. This was because these two samples were the only cultures grown without seawater that belonged to the cluster of cultures grown in the presence of seawater (Figure 4, purple dashed box). Similarly, fluorescent fingerprint measurements detected two groups of potentially distinct culture samples. Among these, two culture samples [171(+) and 171(-)] produced by strain 171 were categorized into the same group, irrespective of the presence or absence of seawater in the growth media (Figure 5). The same result was also obtained with strains 177 and 188 (Figure 5). Thus, this fingerprinting technology alone was sufficient to conclude that these three strains were distinct from the others. However, with the hybrid analysis outlined here, one can even prioritize these unique culture samples by further characterizing and differentiating them from a novel perspective. For example, hybrid analysis can predict that, among the three unique strains (171, 177, and 188) identified by fluorescent fingerprint measurements (Figure 6), 171 is the most promising candidate for further evaluation. This is because two culture samples [171(+) and 171(-)] produced by this strain were classified into completely different clusters in both LC-DAD (Figure 3) and LC-MSD (Figure 4) analyses. As for stain 177, two culture samples [177(+) and 177(-)] produced by this strain were also categorized into two different main clusters in LC-MSD analysis (Figure 4), based on the presence or absence of seawater in the culture media. However, these samples were placed in the same main cluster in LC-DAD analysis (Figure 3). The same observations were made with two culture samples [188(+) and 188(-)] produced by strain 188. Importantly, one of the two main clusters in Figure 3 that contained both of these samples [188(+) and 188(-)] had fewer members than the other main cluster that included the culture samples [177(+) and 177(-)] of strain 177. Thus, based on these evaluations, we can conclude that the three strains should be further investigated in the following order of priority: 171 > 177 ≧ 188.
Here, I described an example of hybrid analysis. In this example, the results of LC-DAD-MSD analysis of culture samples were integrated into those of fluorescent fingerprint measurements that were obtained previously using the same samples. Hybrid analysis combines multiple sets of information collected from different assays. Thus, this approach can identify promising candidates from many culture samples, even when a single analytical method fails to clearly detect them. Furthermore, hybrid analysis can even prioritize these candidate samples. In order to develop new drugs from natural resources, our research group has been screening many natural products. Currently, we use their bioactivities determined by bioassays as indicators of potential drug efficacy. Thus, we are excited about the prospect of incorporating hybrid analysis into our screening protocol. Bioassays choose candidate culture samples based solely on their strength of bioactivities. Thus, they sometimes select similar samples for further evaluation. This ultimately results in the isolation and identification of the same compound as a bioactive material from multiple culture samples. In contrast, hybrid analysis can objectively detect promising samples using only measurement data obtained from many different assays. Thus, we expect that the use of this analytical approach will lead to a more detailed classification of culture samples that show similar bioactivities. In addition, it may even prevent the selection of unsuitable culture samples. Currently, we are analyzing approximately 500 culture samples. As the analysis incorporates their bioactivities for data processing, the results are expected to be very interesting. Hopefully, I will have an opportunity to report on them in the future, as a follow-up communication to this article.
Acknowledgements
I would like to thank Prof. Hiroshi Tomoda at the Graduate School of Pharmaceutical Sciences, Kitasato University, for giving me the opportunity to conduct part of the research presented here in his laboratory. I also wish to thank Prof. Chiaki Imada at the Graduate School of Marine Science and Technology, Tokyo University of Marine Science and Technology, for kindly providing marine samples. Finally, I'm grateful to Dr. Takashi Fukuda, Associate Professor at the Department of Fisheries, Faculty of Agriculture, Kindai University, for his support and advice in preparing this article.
References
Figure legends
See more
