
Yuhei Yamamoto
Assistant Professor
Graduate School of Technology, Industrial and Social Sciences
Tokushima University
Graphite furnace atomic absorption spectrometry (GFAAS) is a method of absorptiometry that proceeds by introducing a tiny quantity—on the order of 10 µL—of a sample into a tubular graphite furnace, atomizing via electrical heating (to 1000–3000°C), and measuring the characteristic optical absorption wavelengths of individual elements. The technique is capable of detecting elements in ultra-minuscule quantities, at the level of nanograms or picograms. Since its inception, GFAAS has advanced in a variety of ways, including mechanical improvements and enhancements in preprocessing and analysis techniques that increase sensitivity and allow measurements in the presence of strong interference. However, the basic principles underlying GFAAS ensure that the method remains problematic for some samples, including elements with high atomization temperatures that exhibit volatility when heated, as well as elements producing strongly bound carbides that resist decomposition.
Boron is an element essential for living organisms, but which can cause organ disease upon excessive ingestion. For this reason, boron concentrations are subject to regulatory thresholds in drinking water and water used for other purposes1). Common uses for boron include glass products, pharmaceuticals, platings, and pesticides. The water found in natural hot springs frequently exceeds environmental regulatory thresholds (1 mg/L)2), and thus measurement of boron levels is important from the standpoint of environmental chemistry and public health. In addition, in recent years the development of boron neutron capture therapy (BNCT) as a cancer treatment has created a need for analytical techniques capable of rapidly analyzing trace quantities of boron in the bloodstream3). Inductively coupled plasma (ICP) optical emission spectrometry and ICP mass spectrometry are generally used for an analysis of trace quantities of boron in solution but still have room for improvement in terms of preprocessing techniques and sample volume required. At standard temperature and pressure, boron in aqueous solution exists in the stable form of boric acid (H3BO3), but dissipates readily upon boiling via water-vapor distillation4). Inside a graphite furnace, on the other hand, as the temperature increases boron and carbon form the stable species boron carbide (B4C), which remains inside the furnace even at temperatures near the upper limits of commercial GFAAS instruments (2800–3000°C). The pyrolysis and atomization stages are also accompanied by the formation of volatile boron oxides5). Consequently, it has conventionally been thought that boron—which exhibits both the properties of easy dissipation and production of strongly-bound compounds that resist decomposition—should be poorly suited to detection via GFAAS in terms of analytical performance. Indeed, without the addition of chemical modifiers it is not possible to measure boron even at a concentration in the mg L-1 level. By using chemical modifiers such as Ca, Ti, Mg, citric acid, and ascorbic acid, as well as Zr coatings, measurements with detection thresholds as low as 20–200 µg L-1 have been reported6-8)—but such sensitivity levels remain inferior to those of ICP optical emission spectrometry or ICP mass spectrometry.
In recent work we have successfully used Fe as a chemical modifier to improve boron detection thresholds, and in this paper we discuss three aspects of this research. We begin in Section 2 with i) a discussion of the characterization of Fe modifiers9). We then discuss the mechanism of boron atomization in the presence of Fe modifiers, using both ii) a spectroscopic approach10) (Section 3), and iii) an approach based on kinetic theory11) (Section 4).
Figure 1 shows absorbance profiles for boron (80 ng) acquired with a ZA3000 and a Z-2710 using Fe modifiers. For comparison we also show an absorbance profile acquired with a ZA3000 using Ca modifiers, which were used in previously reported studies. With Ca modifiers, the maximum absorbance is 0.30—a high value—but the relative standard deviation (RSD) is 0.349, indicating poor reproducibility. With Fe modifiers, the maximum absorbance is 0.27, lower than for Ca, but the RSD is 0.0368, indicating higher reproducibility than Ca. In previous reports, Ca modifiers were used together with coating agents6-8), and the poor reproducibility may be attributed to the fact that no coating treatment was applied. In contrast, Fe modifiers yield high reproducibility and adequate absorbance without coating treatment. Coating treatments are time-consuming and cumbersome and decrease in efficacy as the number of measurements increases. Thus, the use of Fe modifiers, which allow stable measurements to be made without coating treatments, can be considered more appropriate for measurement of element quantities. The maximum absorbance measured by the Z-2710 is lower than that measured by the ZA3000. This is because the extent of atomization temperature overshoot at the optical temperature control cutoff is relatively small9). High atomization temperatures are effective for atomization of boron. The detection threshold for measurements of boron with the Z-2710 using Fe modifiers was 2.6 µg L-1 9). This represents an order-of-magnitude improvement over previous reports, demonstrating the usefulness of Fe for measurements of boron volumes via GFAAS.
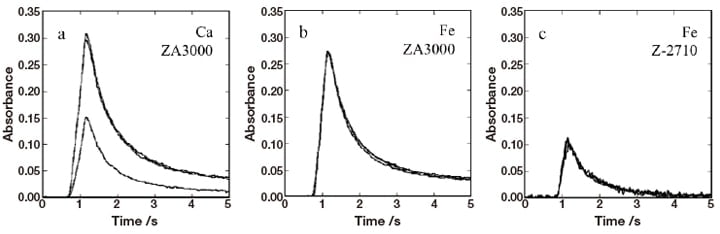
Fig. 1 Boron absorbance profiles obtained using Ca modifiers (a) and using Fe modifiers (b,c). Measurements were made using a ZA3000 in cases (a,b) and using a Z-2710 in case (c).
Boron: 80 ng
Modifiers: 20 µg
Figure 2 shows scanning-electron-microscope images of an inner wall surface of the graphite furnace after raising the temperature to the pyrolysis stage using Ca modifiers [Figure 2(a)] and using Fe modifiers [Figure 2(b)]. In the former case, Ca partially covers the graphite surface in a layered configuration, leaving only a scattered patchwork of exposed graphite regions. In contrast, Fe covers the graphite surface in a configuration resembling a thin-wire mesh network, leaving most of the graphite surface exposed. These disparate distributions reflect different behavior prior to the pyrolysis stage for the two species of modifiers, influencing the nature of the interaction between boron and the graphite surface. Among the roles played by modifiers are a) to form stable compounds with target atoms that prevent these atoms from escaping from the furnace at the drying and pyrolysis stages, b) to react aggressively with carbon atoms to prevent target atoms from forming strongly-bound carbides that resist decomposition, and c) to reduce chemical interference by forming volatile compounds with contaminant atoms12). Ca does not form stable compounds with boron; moreover, this system does not exhibit behavior c) above, suggesting that it exhibits behavior b). Meanwhile, carbides of Fe are not stable, and the fact that behavior c) is absent in this system suggests that it exhibits behavior a).

Fig. 2 Secondary-electron images of the inner furnace walls at the pyrolysis stage (a) with Ca modifiers and (b) with Fe modifiers. Black and white regions correspond respectively to exposed regions of the graphite surface and regions covered by modifiers.
When Fe modifiers are added to the system, they exist in the chemical state of 3-valent Fe ions; because the graphite furnace eventually reaches high temperatures of 2800–3000°C, Fe is ultimately reduced to a 0-valent metal state, but their chemical state at the drying and pyrolysis stages varies depending on the interior temperature of the furnace. Knowledge of the chemical state of Fe is important for an understanding of the role played by Fe modifiers. One effective method for analyzing chemical states of elements is X-ray absorption fine structure (XAFS) 13), which makes use of the fact that the X-ray absorption spectrum depends on its oxidation number of a target element and on the local structure of its surroundings; advantages of XAFS include high element selectivity, applicability to concentrations below the mg kg-1 level, and imperviousness to state of matter (gas, liquid, or solid). XAFS methods may be subdivided into X-ray absorption near edge structure (XANES) and extended X-ray absorption fine structure (EXAFS) techniques, with the latter on the high-energy side. In this study, we use XANES to analyze chemical states of Fe.
Figure 3 shows XANES spectra for Fe modifiers inside the graphite furnace at the conclusion of the pyrolysis stage for various pyrolysis temperatures between 789 and 1975 K. Spectra for some reference materials are also shown for comparison. Ordinarily, oxidizing chemical species exhibit peaks at higher energies, while reducing chemical species exhibit peaks at lower energies. A comparison to spectra for reference materials shows that, for pyrolysis temperatures of 1026 K and below, Fe inside the graphite furnace exhibits a peak at the same locations as 3-valent Fe2O3; another similarity is the appearance of a shoulder-like feature at lower energies. At 1184 K and 1263 K the peak energy shifts slightly downward—closer to that of Fe3O4—indicating partial reduction of Fe. At 1342 K and 1501 K the peak energy is close to that of FeO. At 1659 K and 1975 K the peak shift slightly upward and a prominent low-energy shoulder appears, resembling the spectrum of metallic Fe.
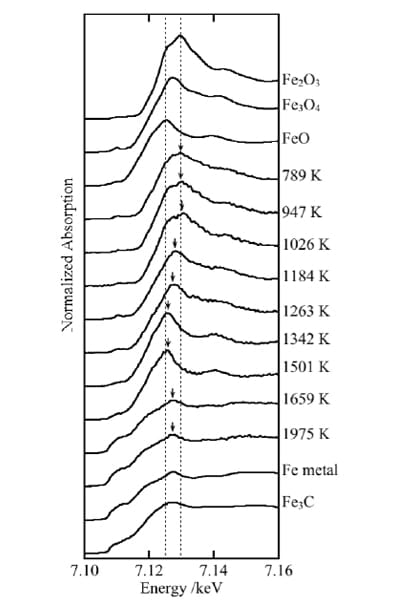
Fig. 3 XANES spectra of Fe modifiers, measured at the conclusion of the pyrolysis stage. Spectra for Fe2O3, Fe3O4, FeO, Fe metal, and Fe3C are also shown for comparison. Dashed lines indicate the positions of the energy peaks in FeO and of Fe2O3.
Figure 4 shows, for each pyrolysis temperature, the absorbance of boron as determined from pyrolysis curves and the mean oxidation number of Fe modifiers obtained from XANES spectra. As the temperature rises, the absorbance first exhibits a plateau over the interval 900–1300 K, then decreases and plateaus at a lower value between 1400–1750 K, after which it decreases monotonically. The mean oxidation number of Fe remains high for pyrolysis temperatures below 1026 K, as Fe2O3 and Fe3O4 are the dominant chemical species in this regime. It decreases gradually over the range 1026–1501 K—in which FeO is the dominant species—then drops sharply between 1501 and 1659 K, falling to a mean oxidation number of 0 beyond 1659 K as metallic Fe is the dominant species in this regime. The temperature dependences of the two quantities are roughly consistent, indicating that the chemical state of Fe modifiers affects the absorbance of boron. As Fe oxides with high oxidation numbers yield high absorbance, we conclude that low pyrolysis temperatures are optimal for quantifying the presence of boron.
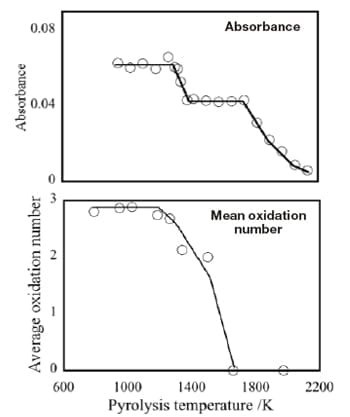
Fig. 4 Pyrolysis curve of boron absorbance (upper plot) and mean oxidation number of Fe modifiers (lower plot).
Table 1 lists the fraction of boron remaining in the furnace for various choices of the temperatures at the drying and pyrolysis stages. With no Fe modifiers added, the fraction of boron remaining in the furnace at the conclusion of the drying stage (573 K) was below the lower detection threshold (3.3% or below). With Fe modifiers added, this rises to 17.7%, indicating that some 80% of boron has escaped by the end of drying. For the pyrolysis stage, at a temperature of 773 K the fraction of remnant boron was essentially unchanged from that at the end of drying, but at 1738 K and above this quantity again fell below the detection threshold. Upon their addition to the graphite furnace, Fe chemical species—both those remaining in solution and those that precipitate out of solution—interact with boron to yield stable capture after drying. This result is consistent with previous studies reporting adsorption of Fe oxides and Fe hydroxides to boron. We conclude that adsorption of boron to Fe compounds serves to reduce the escape of boron from the furnace. In addition, Fe2O3 and Fe3O4 capture boron during pyrolysis and retain it until pyrolysis is complete. As the pyrolysis temperature increases and Fe is reduced to lower oxidation states, the boron-retaining capability of Fe compounds diminishes, vanishing almost entirely for pyrolysis temperatures at which metallic Fe is the dominant chemical species.
| Stage | Modifiers | Absolute temperature (K) |
Remnant fraction (%) |
|---|---|---|---|
| Drying | None | 573 | <3.3 |
| Fe | 573 | 17.7 | |
| Pyrolysis | Fe | 773 | 17.9 |
| 1073 | 11.7 | ||
| 1738 | <3.3 | ||
| 2133 | <3.3 |
Under conditions such that the temperature increase during the atomization stage takes place at a constant rate, we can analyze the absolute temperature of the furnace walls and the absorbance profiles on the basis of kinetic theory; this analysis allows us to determine the activation energy Ea of the reaction that produces atomic vapor and the standard change in enthalpy ΔH associated with this phase transition12),14). For Pb and Au, kinetic-theory analyses
based on solid-state reaction kinetics have been reported previously15)-18). However, the high atomization temperature of boron makes it difficult to obtain absorbance profiles for processes involving constant-rate temperature increases.
Figure 5 shows the time-absorbance profile of the boron in the presence of Fe modifiers (80 ng B, 20 µg Fe, pyrolysis temperature 947 K), measured using the GFAAS Z-2710, as well as the time dependence of the interior temperature of the furnace. We see that the time at which the absorbance attains its peak value lies within the steady-state interval following the overshoot of the cutoff time due to the optical temperature control mechanism. Thus, the regime corresponding to absorbance in the presence of a constant-rate temperature increase—the only case in which analysis based on kinetic theory is applicable—is confined to just the earliest portion of the atomization stage. Under these conditions, the process of constant-rate temperature increase corresponds to the interval from t=0.12 s to t=0.94 s, during which time the absolute temperature rose from T=1260 K to T=2710 K. From the maximum absorbance Amax and the absorbance At at time t, we can compute the reactivity α=At/Amax, for which the average value is 31 ± 19%. Thus, analytical methods premised on the assumption of high values of α during the process of constant-rate temperature increase are not appropriate for use under these conditions11).
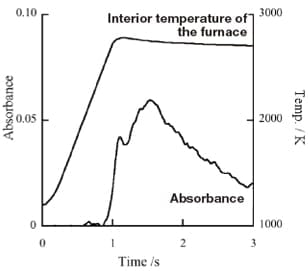
Fig. 5 Relationship between boron absorbance profile and interior temperature of the furnace. Fe modifiers used; Z-2710; Boron 80 ng, Fe modifiers 20 µg. The interior temperature of the furnace was measured using a radiation thermometer (Konica Minolta TR-630).
Sturgeon's method is one approach, rooted in kinetic theory, for analyzing the absolute furnace temperature and the absorbance profiles. The method assumes that, for processes in which steady-state conditions apply—such that α remains constant over short time intervals in which the activities of all chemical species remain constant—a linear proportionality exist between the rate constant for production of atomic vapor and the vapor pressure PM(g) of the atomic vapor; this has the advantage that Amax is not required in the Arrhenius plot, and yields the quantity Ea over intervals small enough that the change in the volume of atomized matter at the atomization stage is negligible compared to the volume of non-atomized matter14). The range of applicability of Sturgeon's method extends to approximately α=30%; it is appropriate for cases, like that of boron, in which absorbance is attained within a narrow interval in processes of constant-rate temperature increases.
In Sturgeon's method, we write the Arrhenius-like equation
![]()
where R is the gas constant, T is the interior temperature of the furnace, and A0 is a constant. The quantities Ea and ΔH may be determined from the slope of a plot of ln At vs. T-1.
Figure 6 plots ln At against T-1 for boron in the presence of Fe modifiers at pyrolysis temperatures of 974 K and 1740 K. The linear relationship holds over the time interval t=0.80–1.00 s in the former case and over the interval t=0.40–0.60 s in the latter case. As we see from the pyrolysis curve of Figure 4, the reaction responsible for producing atomic vapor from boron in the range 900–1300 K differs from the reaction that dominates in the range 1400–1750 K. The values of Ea determined by Sturgeon's method average to 799 ± 72 kJ mol-1 for the temperature range 900–1300 K, and to 485 ± 78 kJ mol-1 over the range 1400–1750 K.
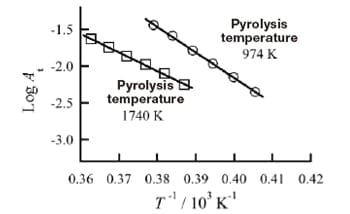
Fig. 6 Arrhenius plot of boron absorbance
Table 2 lists the possible atomization reactions for boron compounds, with corresponding values of ΔH per mole of boron atoms, that may be postulated on the basis of physical chemistry19). Comparing Ea to ΔH, we see that, for pyrolysis temperatures in the range 900–1300 K, Ea takes values similar to those for the oxide decomposition reactions of eq. 2 (ΔH=789 kJ mol-1) and eq. 3 (ΔH=821 kJ mol-1). In contrast, for temperatures in the range 1400–1750 K, the values match those for the decomposition of B4C, equations 4,5,6 (ΔH=555, 493, 484 kJ mol-1). Thus, we conclude that, in the pyrolysis curve of Figure 4, the rate-limiting step in the range 900–1300 K is the decomposition of boron oxides, while in the range 1400–1750 K the rate-limiting step is the decomposition of boron carbides. Because the oxidation number of Fe modifiers varies with pyrolysis temperature, the chemical state of boron at the pyrolysis stage varies as well, shifting the nature of the rate-limiting step in the reaction.
| Model reaction | ΔHr /kJ mol-1 | eq. No. |
|---|---|---|
| Decomposition of boron oxides | ||
| BO(g) → B(g) + O(g) | 789 | eq.2 |
| B2O3(g) + 3C(s) → 2B(g) 3CO(g) | 821 | eq.3 |
| Decomposition of boron carbides | ||
| 2B4C(s) + O2(g) → 8B(g) + 2CO(g) | 555 | eq.4 |
| B4C(s) +O(g) → 4B(g) + CO(g) | 493 | eq.5 |
| B4C(s) + O2(g) → 4B(g) + CO2(g) | 484 | eq.6 |
In this study, we investigated the use of GFAAS to measure boron concentrations and found that Fe modifiers are more effective for this purpose than conventional modifiers. The absorbance of boron decreases in stages as the pyrolysis temperature is increased. A spectroscopic analysis showed that the decrease in absorbance approximately coincided with a decrease in the mean oxidation number of Fe modifiers. We conclude that absorbance decreases at higher pyrolysis temperatures because the Fe chemical species prevalent at those temperatures—FeO and metallic Fe, in which Fe is reduced to lower oxidation states—cannot stably retain boron inside the furnace. A kinetic-theory analysis indicates that the rate-limiting step depends on the pyrolysis temperature: for temperatures at which highly oxidized Fe species are prevalent (900–1300 K), the rate-limiting step is the decomposition of boron oxides, while for temperatures at which less oxidized Fe species dominate (1400–1750 K) the rate-limiting step is the decomposition of boron carbides. Our findings show that low pyrolysis temperatures are most appropriate for boron measurements. Moreover, our detailed analysis of the mechanism of atomization offers promising potential for improved performance in measuring elements that are difficult to observe.
References
See more
