
Rie Shishido
Institute of Multidisciplinary Research for Advanced Materials
Tohoku University
Collaborating authors
Masaya Mitsuishi*1
Shigeru Suzuki*2
Secondary ion mass spectrometry (SIMS) is a significant method for the developments of novel materials aiming for industrial applications, and it is possible to investigate various materials from inorganic materials such as metals, semiconductors and ceramics to organic materials such as polymers and biological tissues. In SIMS measurements, the components of the surfaces and the interfaces are evaluated by analyzing the secondary ions emitted as a result of ion-surface interactions (Figure 1 (a)). Therefore, the background level of this technique is low and the high sensitivity is achieved. SIMS has been originally developed for identifying the impurities of the semiconductors, and magnetic sector (MS) and quadrupole (Q) mass spectrometers were used1, 2). Static SIMS established in 1960s enabled to evaluate organic materials3). In this technique, the structures of organic molecules are maintained during the ionization process due to keeping the dose densities of the primary ions under the static limit (1×10¹²–1×10¹³ ions/cm2). After metal cluster ions such as Aun+ and Bin+, and massive clusters such as C60+ and Arn+ have been developed4-7), static SIMS extended its applications from investigation of the surface composition to evaluation of the two- and three-dimensional distributions of macromolecules. With the developments of primary ion sources accompanied by the improvements of mass spectrometer, and a time of flight (TOF) spectrometer which enables to analyze the target with wide mass ranges was used for the static SIMS analyzer. Currently, the term "TOF-SIMS" has the same meaning as "static SIMS", and the method is used in various research fields such as materials engineering, life science and fundamental medicine.
TOF.SIMS 5 (ION-TOF GmbH) at Institute of Multidisciplinary Research for Advanced Materials (IMRAM), Tohoku University is used as the central analytical facility8), and provides elemental and molecular information to the researchers inside and outside the research institution (Figure 1 (b)). This model has a Bi cluster source, and it is possible to evaluate inorganic and organic materials. On the other hand, the number of research institutions which possess such a large-scale machine is limited, and a shared machine system has been promoted nationwide. The Network Joint Research Center for Materials and Devices is composed of the five research institutes including IMRAM, and this center supports research activities across universities and other institutions by promoting joint researches9). In this report, the results obtained by this supports, and potential of TOF-SIMS applications are described.
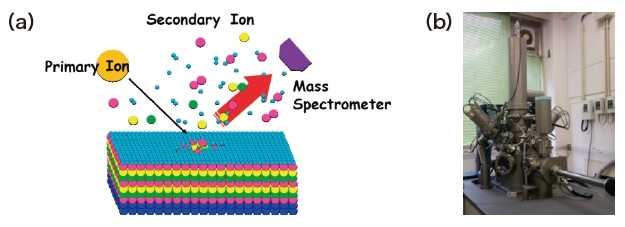
Fig. 1 Schematic illustration of SIMS principle (a) and TOF.SIMS 5 installed as Central Analytical Facility at IMRAM, Tohoku University (b)
Steel materials are used for various purposes such as automobile components, building-related products and chemical plants. Small amounts of light elements which occupy interstitial sites affect their mechanical properties. Even among those, it is difficult to analyze the behavior of hydrogen because it exhibits low solubility in steel and large diffusion velocity at room temperature10, 11). TOF-SIMS with high sensitivity and spatial resolution is a powerful method of detecting hydrogen, and has been used for the investigation of small amounts of carbon and boron atoms in steel12, 13). In TOF-SIMS depth profile measurements, different f rom Dynamic SIMS, the dual beam mode, which combines sputter ion beams with primary ions, is used14). In this technique, both the high depth resolution and transmittance are achieved, because the extractor of the TOF analyzer is regulated by applying voltage intermittently. In this section, the concentration distributions of the light elements in the micro area of the duplex stainless steel obtained by using dual beam technique are discussed.
Duplex stainless steel with austenite and ferrite (22.4Cr-5.3Ni-3.2Mo-0.35Si-1.0Mn-0.16N-0.013C; in mass%) is selected as an evaluation sample. Deuterium was doped into the sample for 24 hours by electrolytic cathode charge method, and electrical polishing was subjected to the doped sample.
In the TOF-SIMS measurement, a 25 kV of Bi1+ ion beams were used as a primary ion species, and negatively charged secondary ions were analyzed. The burst alignment mode by which high spatial resolution is achieved was selected as this evaluation. The sputter ions were Cs+, and their energy was set at 500 V. The interlaced mode, sputtering the surface during the mass spectrometry, was used. The vacuum pressure of the main chamber was kept below 2.0 × 10⁻⁷ Pa.
Figure 2 (a) shows images of duplex stainless steel after doping 2H2O. It was found that the distribution of 2H is different from that of C− and CN−. In addition, EPMA measurements were performed to obtain the images of Ni, Cr and Mo (Figure 2 (b)). The results indicate that the region with high concentration of Cr and Mo is the ferrite phase and that of Ni was the austenite phase. Therefore, it can be concluded that the austenite phase contains the high concentration of C and N, and that 2H distributes in the ferrite phase15).
![Fig. 2 TOF-SIMS images of duplex stainless steel after doping 2H2O (a) and the metallography distributions obtained with EPMA (b) [Adapted from Ref. (15)]](/image/global/sinews/si_report/130202/index_03.jpg)
Fig. 2 TOF-SIMS images of duplex stainless steel after doping 2H2O (a) and the metallography distributions obtained with EPMA (b) [Adapted from Ref. (15)]
In the TOF-SIMS measurements, it is possible to obtain the mass spectra for each image pixel. To investigate the concentration distributions of light elements in the micro area, we conducted the quantitative evaluation by using the signal counts at each pixel. The signal counts of C from a pixel is used as an index to distinguish between the two phases. The total area was divided into 15 regions by the percentage of the C counts against its maximum counts/pixel (mc). The integrated peak intensities of 2H, FeN, Cr and Ni are calculated in the 15 regions and they are normalized by the Fe counts. Figure 3 shows the relations between the C concentration and those of other elements. It is found that the concentrations of Cr and Ni are gradually shifted with increasing that of C, and their relations showed inverse correlation. If the region with high concentration of C and Ni is defined as the austenite phase, it was indicated that higher Cr concentration regions were observed in the austenite phase. The normalized values of FeN, which is rich in the austenite phase, increase as the C concentration increases. However, its concentration distribution differs from that of C in a certain area of the austenite phase. Doped 2H value exhibited a trend that is similar to that of Cr. It is revealed that the 2H concentration increases while the Cr concentration decreases in the ferrite phase as the C concentration increases.
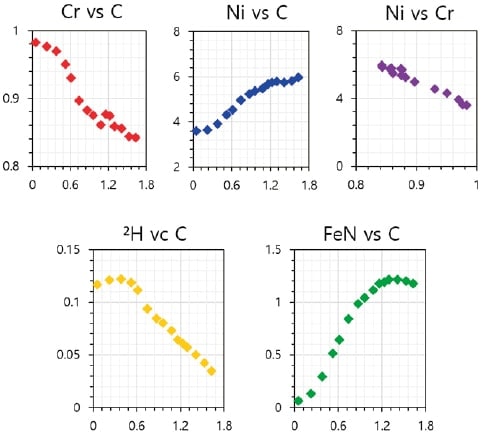
Fig. 3 Correlation diagram of elements of duplex stainless steels and doping deuterium concentrations against that of carbon.
The analytical area were divided into 6 regions using the correlation diagram (Figure 3) to investigate the heterogeneous distribution of the elements, and these regions were overlaid as green highlighted area on the C distribution image (Figure 4). These images show that the ferrite phase has higher concentration region of Cr, and the higher concentration area of 2H is observed especially at the interface between the ferrite and austenite phases (Figure 4). It is known that light elements are readily dissolved into the austenite phase with the fcc crystal structure, compared with the case in the ferrite phase with the bcc structure. However, these images indicate that the discrepancy of the concentration distribution of C and N (FeN) is observed in the austenite phase (Figure 4). Furthermore, it is revealed that the austenite phase had area in which no overlap was observed between Cr and C. This infers that the segregation in the austenite phase occurred by heat-treatment in the stainless steel manufacturing process.
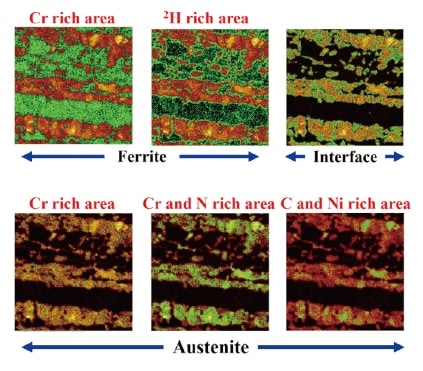
Fig. 4 The analysis area are divided by 6 regions based on concentrations of constituent elements of duplex stainless steel and doped deuterium. These regions are shown by the green area overlaid carbon image.
TOF-SIMS is a relatively new analytical method, and undeveloped scientific fields still exist from viewpoints of not only instrumental developments but also analysis and evaluation techniques. Therefore, it is important to establish the TOF-SIMS technique which enables appropriate handling of the enormous data. In conclusion this method is effective for the investigation of light elements distributions in metal material microstructures.
Bi cluster ions which are one of the most utilized primary ion sources of TOF-SIMS have high beam convergence because the ions are generated by field emission. On the other hand, the sensitivities of the large molecules obtained with Bi cluster ions are worse than that obtained with massive cluster ions such as Ar cluster16), because the greater kinetic energy of the Bi ions leads to severe damage to the surfaces. In the imaging analysis, both the probe diameter and the sensitivities of analyzed molecules correspond to important factors of the spatial resolution. Unlike in the case of the inorganic, the secondary ions emitted from organic surfaces decrease with increasing the dose density of the primary ions. The influence of the surface damages becomes more significant when the dose density is beyond the static limit. The optimization of several analytical conditions are required to obtain the information on micro-scale distributions of organic molecules. Under the current circumstances, no consensus about measurement conditions exist among the end users because the optimized values depend on the primary ion source type and target molecule. In this section, we investigated the effects of yields and damage cross-section on the spatial resolution of organic molecules by using different primary Bi ions in TOF-SIMS measurements.
N,N'-Di(1-naphtyl)-N,N'-diphenylbenzidine (C44H32N2, NPD) and 4,4',4''-tris[2-naphthyl(phenyl)-amino]-triphenylamine (C66H48N4, 2-TNATA) are selected as evaluated molecules. Three Bi1+, Bi3+ and Bi32+ ions accelerated at 25 kV are bombarded onto the surfaces, and positively charged secondary ions were analyzed. Thin film samples, NPD and 2-TNATA were vacuum deposited onto Si wafer, and were used for the investigation of the secondary ion yield and damage cross-section. The Bunching mode which provides high mass resolution was used for this evaluation. The analysis area was set at 250 × 250 µm2, and the primary ion beams were scanned randomly at a resolution of 128 × 128 pixels. The dose density of primary ions was 4.2 × 10¹² ions/cm2. For the evaluation of the spatial resolution, a 2-TNATA film vacuum deposited on a Si wafer surface and a patterned NPD (787 lines/cm) film were used. The burst alignment mode was selected, and the observation area was 50 × 50 µm2. The primary ions were scanned with a resolution of 128 × 128 pixels, and the sawtooth scanning mode was used. The dose density was 2.0 × 10¹² ions/cm2.
Figure 5 shows mass spectra of NPD (a) and 2-TNATA (b) obtained with Bi3+ ions. The peaks were assigned to C44H32N2+ (m/z = 588), C66H48N4+ (m/z = 896) and C16H11N+ (m/z = 217) which are fragment ions from both molecules. Furthermore, C28H21N+ (m/z = 371) from NPD and C44H32N3+ (m/z = 602) and C50H37N3+ (m/z = 679) from 2-TNATA are also detected. The secondary ion yields calculated from the integrated peak intensities of these molecules are shown in Table 1. The yields gradually decrease with increasing the dose density of primary ions. These results suggest that the counts of the secondary ions are decreased due to damage the surface structure by irradiation of the primary ions. The highest yields of NPD and 2-TNATA are achieved when Bi32+ was used under the static limit condition (1.1 × 10¹² ions/cm2). On the other hand, the highest yield of NPD with Bi3+ was obtained when the dose density was 4.2 × 10¹² ions/cm2. The damage cross-section obtained from the yields in Table 1 is summarized in Table 2. It was found that the damage cross-sections of all molecules with Bi32+ were the highest, and these values depend on the molecular weight. Furthermore, these results indicate that the primary ion species, which achieves the highest yield, change from Bi32+ to Bi3+ ions by increasing the dose density.
![Fig. 5 Mass spectra of NPD (a) and 2-TNATA (b) obtained with Bi3+ ions. [Adapted from Ref. (17)]](/image/global/sinews/si_report/130202/index_06.jpg)
Fig. 5 Mass spectra of NPD (a) and 2-TNATA (b) obtained with Bi3+ ions. [Adapted from Ref. (17)]
Table 1 The secondary ion yields of NPD (a), 2-TNATA (b) and the fragment ions derived from these molecules. [Adapted part of Ref. (17)]
| PIDD (ions/cm2) |
C16H11N+ (×10−5) |
C28H21N+ (×10−5) |
C44H32N2+ (×10−5) |
|---|---|---|---|
| 1.1×10¹² | 7.3 | 4.7 | 16 |
| 2.1×10¹² | 6.8 | 4.1 | 13 |
| 3.2×10¹² | 6.2 | 3.6 | 11 |
| 4.2×10¹² | 5.8 | 3.2 | 9.8 |
| PIDD (ions/cm2) |
C16H11N+ (×10−3) |
C28H21N+ (×10−3) |
C44H32N2+ (×10−3) |
|---|---|---|---|
| 1.1×10¹² | 2.8 | 1.3 | 4.1 |
| 2.1×10¹² | 2.5 | 1.1 | 3.0 |
| 3.2×10¹² | 2.2 | 0.89 | 2.3 |
| 4.2×10¹² | 2.0 | 0.75 | 1.8 |
| PIDD (ions/cm2) |
C16H11N+ (×10−3) |
C28H21N+ (×10−3) |
C44H32N2+ (×10−3) |
|---|---|---|---|
| 1.1×10¹² | 3.6 | 1.7 | 4.4 |
| 2.1×10¹² | 3.0 | 1.3 | 2.8 |
| 3.2×10¹² | 2.5 | 0.98 | 2.0 |
| 4.2×10¹² | 2.1 | 0.79 | 1.6 |
| PIDD (ions/cm2) |
C16H11N+ (×10−5) |
C44H32N3+ (×10−5) |
C50H37N3+ (×10−5) |
C66H48N4+ (×10−5) |
|---|---|---|---|---|
| 1.1×10¹² | 5.0 | 2.8 | 3.0 | 13 |
| 2.1×10¹² | 4.7 | 2.4 | 2.6 | 11 |
| 3.2×10¹² | 4.3 | 2.1 | 2.2 | 9.1 |
| 4.2×10¹² | 4.0 | 1.8 | 1.9 | 7.9 |
| PIDD (ions/cm2) |
C16H11N+ (×10−3) |
C44H32N3+ (×10−4) |
C50H37N3+ (×10−4) |
C66H48N4+ (×10−3) |
|---|---|---|---|---|
| 1.1×10¹² | 2.0 | 8.9 | 9.2 | 3.2 |
| 2.1×10¹² | 1.8 | 6.8 | 7.0 | 2.3 |
| 3.2×10¹² | 1.5 | 5.3 | 5.4 | 1.8 |
| 4.2×10¹² | 1.3 | 4.3 | 4.4 | 1.4 |
| PIDD (ions/cm2) |
C16H11N+ (×10−3) |
C44H32N3+ (×10−4) |
C50H37N3+ (×10−4) |
C66H48N4+ (×10−3) |
|---|---|---|---|---|
| 1.1×10¹² | 2.5 | 11 | 12 | 4.0 |
| 2.1×10¹² | 2.0 | 7.6 | 8.0 | 2.6 |
| 3.2×10¹² | 1.7 | 5.6 | 5.9 | 1.9 |
| 4.2×10¹² | 1.4 | 4.5 | 4.7 | 1.5 |
Table 2 The damage cross-section of NPD (a), 2-TNATA (b) and the fragment ions derived from these molecules. [Adapted part of Ref. (17)]
| C16H11N+ (×10−14cm2) |
C28H21N+ (×10−14cm2) |
C44H32N2+ (×10−14cm2) |
|
|---|---|---|---|
| Bi1+ | 3.3 | 5.3 | 6.7 |
| Bi3+ | 5.1 | 7.7 | 12 |
| Bi32+ | 7.8 | 11 | 14 |
| C16H11N+ (×10−14cm2) |
C44H32N3+ (×10−14cm2) |
C50H37N3+ (×10−14cm2) |
C66H48N4+ (×10−14cm2) |
|
|---|---|---|---|---|
| Bi1+ | 3.0 | 5.9 | 6.3 | 6.4 |
| Bi3+ | 6.0 | 10 | 10 | 11 |
| Bi32+ | 7.8 | 12 | 13 | 14 |
Figure 6 shows images of NPD/2-TNATA. It was found that the distributions obtained with cluster ions were clearer than that of monomer ions. The evaluation of the spatial resolution was conducted by using the results of Bi3+ and Bi32+, because the signal counts obtained with Bi1+ was insufficient for the evaluation. The spatial rosolution was difined as the distance from 16% to 84% of the signal intensity at the boundary of NPD and 2-TNATA. The higeset value tend to be obtained from Bi32+ ions measurements, and was determined as approximately 1.0 µm.
![Fig. 6 Images of NPD/2-TNATA obtained with Bi1+, Bi3+ and Bi32+ ions. [Adapted from Ref. (17)]](/image/global/sinews/si_report/130202/index_07.jpg)
Fig. 6 Images of NPD/2-TNATA obtained with Bi1+, Bi3+ and Bi32+ ions. [Adapted from Ref. (17)]
Table 3 Spatial resolution of NPD and 2-TNATA. [Adapted from Ref. (17)]
| NPD | 2-TNATA | |
|---|---|---|
| Bi1+ | unmeasurable | unmeasurable |
| Bi3+ | 1.8 µm | 1.8 µm |
| Bi32+ | 1.3 µm | 1.1 µm |
It was revealed that the primary ion spieces which achived the highest yield was varied as the dose density, and there was correlation between the damage cross-section and the molecular weight. The yileds obtained with cluter ions were more than several tens times larger than that of monomer ions. On the other hand, the damage cross-section of cluster ions was several-fold as large as that of mononer ions. These results indicate that the cluster ions have a distinctive effect on desorprion and ionizarion without expansion of surface sructure destructions. The cluster ion source needs to be used for obtaining the clear distribution images, then it was shown that the spatial resolution depends on the beam diameter in the condition of a certain sensitivity level. From these results, it is concluded that the selection of an appropriate primary ion species is important for imaging analysis of organic molecules.
Recent studies about TOF-SIMS images of inorganic and organic materials are demonstrated in this report. The developments of analytical techniques make it possible to detect a miniscule amount of materials. Undetected targets or uncertain distribution measurements do not mean that analytical targets are not on surfaces. With an understanding of the principles and the characteristics of TOF-SIMS, appropriate use of the TOF-SIMS machine will expand research application fields. The author is glad to contribute to research activities as a result of the effective use of TOF-SIMS through joint researches between worldwide research institutions and Tohoku University.
References
Acknowledgements
The authors thank Prof. Shigeo Sato at Ibaraki University, Prof. Jiro Matsuo at Kyoto University and Dr. Makiko Fujii at Yokohama National University for their guidance and encouragement. The authors also thank Mr. Takashi Kamaya at Tohoku University for his assistance in EPMA measurements.
Collaborating authors
See more
