Jun Horigome, Yuka Iwaya
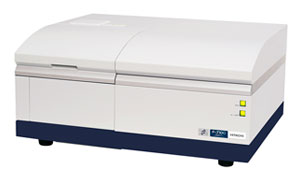
Fig.1
F-7100 fluorescence spectrophotometer
A fluorescence spectrophotometer is an instrument that measures the fluorescence produced by a sample irradiated with optical excitation such as ultraviolet radiation. Fluorescence spectrophotometers are higher-sensitivity analytical instruments than absorption spectrophotometers, which measure light absorption by the sample. Because only fluorescent substances are detected, preprocessing can be used to convert only specific sample components to fluorescent substances, allowing outstanding selectivity for samples with microscopic volumes. Applications of fluorescence spectrophotometers include analysis of pharmaceuticals and foodstuffs – including various types of vitamins and additives – and biochemical studies in areas of clinical medicine including analysis of amino acids. These instruments are also considered valuable tools with a wide range of uses in fields such as analysis of materials such as dyes, fluorescent whitening materials, white LEDs, and display components.
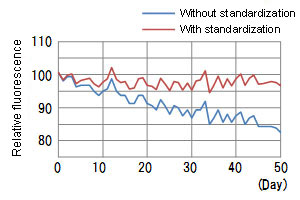
We have recently developed the F-7100 fluorescence spectrophotometer (Figure 1), an instrument based on the previous-generation F-7000 model*1 with improvements in basic performance. The high sensitivity (signal-to-noise ratio) of the instrument – the single most important measure of spectrophotometer performance – is approximately 1.5 times greater than that of the previous-generation model.*1 The Xe lamp – a consumable – boasts a lifetime some 5 times longer than that of the previous-generation model*1. The software has also been improved: we have added functionality to correct day-to-day variations, support for the recently much-discussed task of fluorescent fingerprint analysis, and greater user-friendliness.
In this section we discuss three key features of the F-7100.
The F-7100 retains the highly reliable optical system of the long-selling F-7000 while achieving higher sensitivity through the adoption of a high-brightness Xe lamp and improvements to the detector optical system.
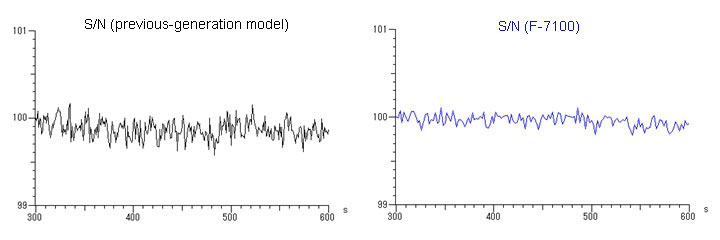
Fig.2
Comparison of signal-to-noise ratio for Raman scattering in water
Figure 2 compares the signal-to-noise ratio of the F-7100 to that of the F-7000 for a measurement of Raman scattering in water. As shown in the figure, compared to the previous-generation model*1, the high-sensitivity F-7100 achieves a 1.5 times improvement in signal-to-noise ratio, allowing detection of even ultra-weak signals with a low noise level.
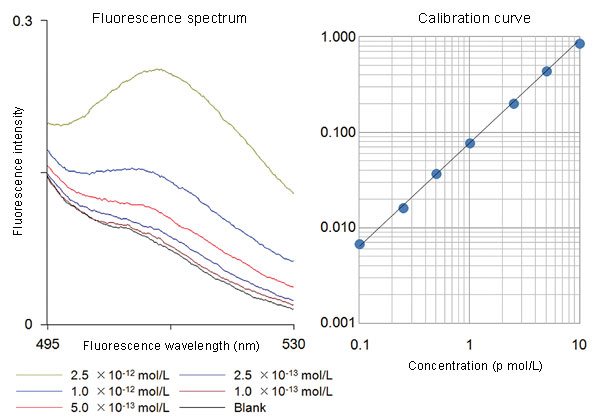
Fig.3
Measurement of ultratrace quantity of fluorescein
Figure 3 shows an example of a high-sensitivity measurement of fluorescein. The F-7100 successfully detects fluorescence at concentrations on the order of 1×10-13 mol/L (sub-picomolar) relative to blank samples (pure water). A good calibration curve is obtained even for ultratrace sample volumes.
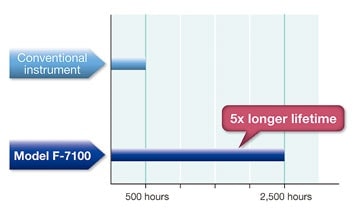
Fig.4
Comparison of lamp lifetimes*2
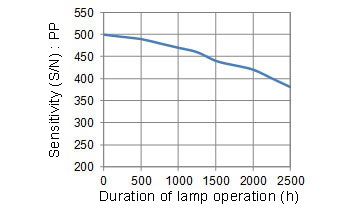
Fig.5
Sensitivity (S/N: PP) vs. duration of lamp operation*4
By adopting a new Xe lamp*3 and improving the lamp illumination power supply, we have succeeded both in increasing the brightness and extending the lifetime of the light source. The longer lamp replacement cycle reduces the cost of consumables and the labor required to replace and adjust the lamp (Figure 4). The high-quality design of the F-7100 and the ample robustness incorporated into its specifications ensure that the high sensitivity of the instrument is retained throughout the entire lifetime of the lamp (Figure 5).

In this article we have presented the key features and new capabilities of the F-7100. Fluorescence analysis finds applications in a wide range of fields, including industrial materials such as LEDs and solar cell components, food testing, life sciences, and biotechnology research and development. In the future, we will continue to develop and commercialize new accessories, software, and applications to meet these and other marketplace needs.
Author
Jun Horigome, Yuka Iwaya
Optical Instrument Design Department
Hitachi High-Tech Science Corporation
See more
