Takuya Sato*1, Chiaki Ito*1, Hitoshi Fujimiya*1, Jun Horigome*2, Hideyuki Sakamoto*2
The practice of quality control at production sites involves making qualitative and quantitative assessments of samples based on a continuous time-varying stream of measured data reported by analytical instruments. Ensuring that the getting information is accurate requires repeating measurements multiple times under multiple sets of conditions. The multivariate (multidimensional) analytical data produced by measurement instruments contains a significant amount of information, including items such as the composition and quantity of samples. For the tasks of separating data into groups based on features and surveying for cause-and-effect relationships, it is essential to have a solid understanding of features of the data based on multivariate analysis.
In recent years, the increased performance and higher integration density of analytical instruments has heightened demand for multivariate-analysis software. Of course, existing general-purpose software packages already offer a bewildering array of analytical functionality based on a wide variety of underlying methods, and the first hurdle faced by users is the choice of which method to use.
To address this situation, we developed the 3D SpectAlyze® software package for multivariate analysis with a particular focus on multidimensional analytical data. By specializing to specific types of target data—such as measured data produced by a fluorescence spectrophotometer or an HPLC system—3D SpectAlyze® is able to provide users with a simple and intuitive trajectory through the entire process from data import to analysis.
In this article we discuss the capabilities of 3D SpectAlyze® and present application case studies.
3D SpectAlyze® imports data in various formats—such as three-dimensional fluorescence spectra captured by a fluorescence spectrophotometer (known as a fluorescence fingerprint), HPLC chromatograms, or three-dimensional chromatogram data files obtained from a diode-array detector (DAD)—processes and graphs the data, and then performs a variety of statistical analyses (multivariate analyses). The results of these analyses may be viewed as on-screen visualizations or exported to CSV files (Figures 1 and 2).
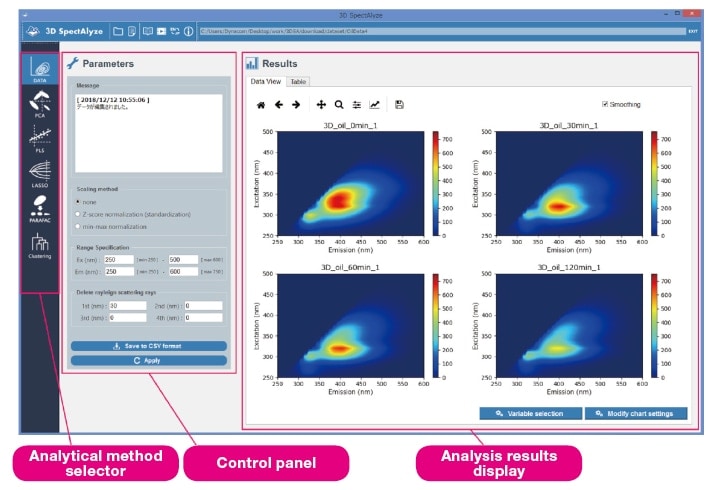
Fig. 1 Organization of the 3D SpectAlyze® display. The four heat maps shown here are plots of data sets that will be discussed in Section 3-1 below.
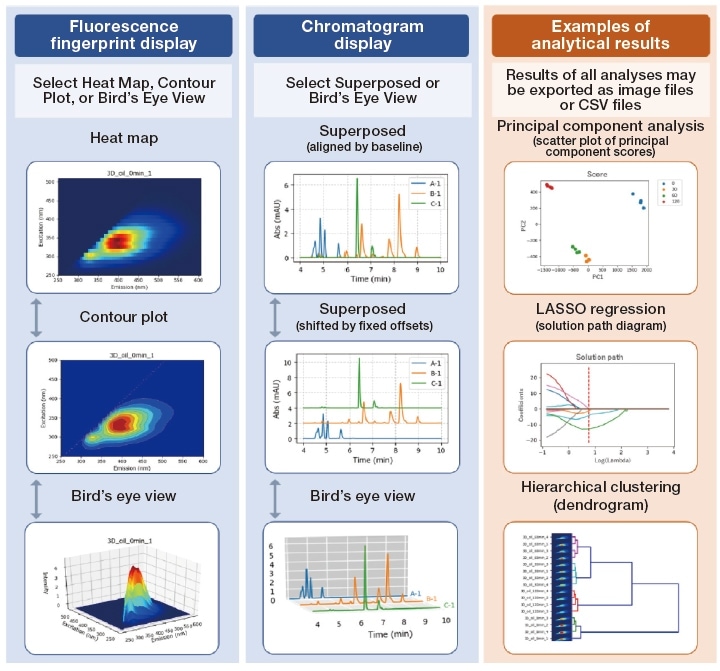
Fig. 2 Output produced by 3D SpectAlyze®
In what follows we briefly summarize the primary operations and analytical algorithms implemented by 3D SpectAlyze®.
The software offers a variety of specialized pre-processing methods for particular types of inputs, such as data from a fluorescence spectrophotometer or HPLC system. For example, the available pre-processing methods for spectrophotometer data include removal of scattered light, removal of unnecessary regions, and normalization. Pre-processed data are immediately reflected in the various statistical analysis windows.
3D SpectAlyze® provides a variety of methods for graphical visualization of data, such as heat maps, contour plots, bird's-eye views, and chromatograms.
(1) Principal component analysis: A method used to group analytical data into categories based on features, with applications including identification of the origins of agricultural products
Principal component analysis is a technique for compressing data with minimal loss of information.
For example, the fluorescence fingerprint of a single sample contains measured data sets (fluorescence intensity data) for many sample points—ranging in number from a few thousand to hundreds of thousands. With this volume of data it is difficult to compare fingerprints between samples. Principal component analysis reduces the number of items to 2 or 3 and produces a scatter plot of the data that lends visual insight into the relationships between samples. For example, given a set of agricultural samples in which the geographical origins of some samples are known and those of others are not, a principal component analysis of measured data can help to identify the origins of the unknown samples.
(2) PARAFAC: Used to separate individual components in blended samples
When measuring the multi-component mixtures of fluorescent materials with spectrophotometer, observed data are superpositions of multiple peaks contributed by the various components. PARAFAC (parallel factor analysis) is
a method for untangling this superposition to yield separate fluorescence data for each distinct sample component. Comparing the peak intensities of the various components after separation then estimates the components present in the sample and their relative concentrations.
(3) Hierarchical clustering: Grouping fluorescence fingerprints by features
Hierarchical clustering is a method that assigns samples with similar characteristics to subgroups within a larger population. The method begins by comparing two samples and grouping based on minimal distance (maximum similarity), then continues linking group after group until ultimately only one group remains. This linking process may be visualized in the form of a dendrogram.
3D SpectAlyze® draws fluorescence fingerprint images or chromatograms corresponding to the positions of sample names within the dendrogram, allowing group features to be identified at a glance.
(1) PLS regression: Designing predictive models, computing predicted values for unknown data
This method uses all available measured data to construct a model to predict the data components (types, concentrations, etc.) that explain the features of a sample. The method of PLS (partial least squares) regression compresses the information content of a multidimensional data set into a small number of dimensions from which to estimate predictive formulas. Thus, it is a particularly powerful technique for analyzing content such as fluorescence fingerprint data, which contains measurements at a large number of wavelengths with correlations between data for different wavelengths.
(2) LASSO regression: Selecting the wavelengths that make the largest contributions, designing predictive models, and computing predicted values for unknown data
The LASSO (Least Absolute Shrinkage and Selection Operator) method constructs a predictive model by automatically extracting from a high-dimensional data set the feature points that are most highly correlated to the data components (types, concentrations, etc.) that explain the features of the sample. In general, the ability of a model to handle unknown data—that is, the model's predictive performance—is degraded by attempting to learn too much about the measured data (overlearning). To avoid this, LASSO regression uses cross-validation methods to monitor predictive performance while selecting wavelengths that make significant contributions to the predicted value—a reasonable approach to constructing a predictive model.
In this section we present two case studies of practical multivariate analyses carried out with 3D SpectAlyze®. First we use principal component analysis and PARAFAC to study how a sample of cooking oil is affected by heating. Then we perform a LASSO analysis to estimate the blend ratio of a sample of fluorescent paint.
The input data for this analysis are three-dimensional fluorescence spectra—acquired using a Hitachi F-7100 fluorescence spectrophotometer—for a sample of cooking oil after heating for 0, 30, 60, and 120 minutes. These three-dimensional fluorescence spectra are the datasets plotted as heat maps in the screenshot of Figure 1. Note that the shape of the fluorescence fingerprint varies with the duration of heating. We now use 3D SpectAlyze® to analyze the data via principal component analysis, with results shown in Figure 3. The analysis lends insight into the influence of heating time on the evolution of the sample. From the score plot of Figure 3 (a), we find that components PC1 and PC2 decreased in volume over the initial 30 minutes of heating, then remained roughly constant for the next 30 minutes. Over the next 60 minutes, however, we see that PC1 decreased while PC2 increased. In this case the volume of component PC1 may be read off from the PC1 loading plot of Figure 3 (b). Because the PC1 loading plot matches the fluorescence intensity distribution plot of the three-dimensional fluorescence spectrum in Figure 3 (d), we conclude that PC1 corresponds to the overall fluorescence intensity. This indicates that the overall fluorescence intensity decreases with increasing duration of heating. On the other hand, for PC2 the values in the vicinity of {excitation, emission} wavelengths of {320,400} nm are negative. During the first 30 minutes of heating, the PC2 score decreases, whereupon this component increases. Between 60 and 120 minutes, the PC2 score increases, indicating that this component decreases.
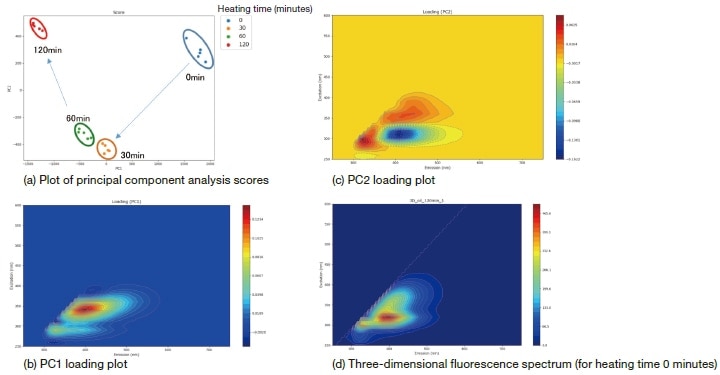
Fig. 3 Results of principal component analysis
As this example demonstrates, plotting the scores computed by the principal component analysis in the form of a scatter plot yields an intuitive visual representation of the influence of heating time on the evolution of the cooking oil sample.
PARAFAC analysis is a method for untangling this superposition of peaks in fluorescence fingerprint to yield separate fluorescence data for each distinct sample component. By comparing the peak intensities of the various components after separation, we can estimate the components present in the sample and their relative concentrations. Figure 4 shows the results of a PARAFAC analysis of the fluorescence fingerprint data for the cooking-oil sample; evidently the method succeeds in separating it into three components. From Reference literature1), we determine that components 1 and 3 originate from oxidation products, while component 2 originates from vitamin E. Comparing the scores computed by the PARAFAC analysis for the various components allows us to determine the relative extent of the changes experienced by each component.
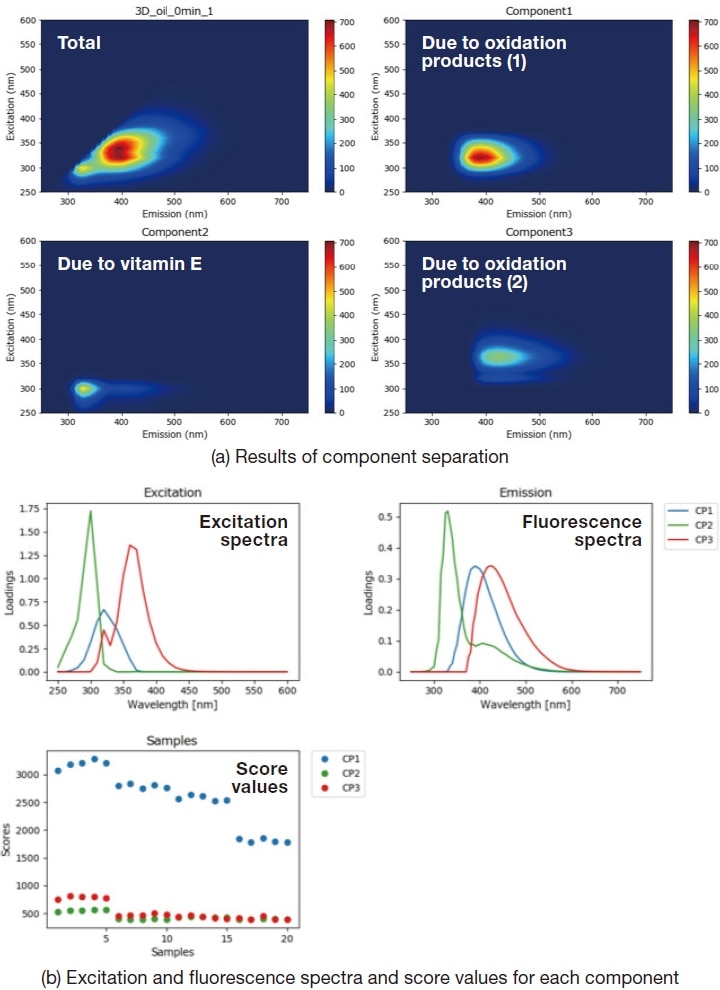
Fig. 4 Results of PARAFAC analysis
For this analysis, we prepare a set of paint-blend samples by mixing two varieties of fluorescent paint—one yellow, one red—in various proportions, then use LASSO analysis to compute the blend ratio of each sample from its fluorescence fingerprint. Samples are labeled by their relative concentration of yellow paint (Y). The relative concentration of red paint is R=(100-Y)%. Figure 5 shows fluorescence fingerprints for a subset of the samples (percentages in white text are Y values). The fluorescence fingerprint of the Y=0% sample exhibits the signature feature of red paint component near {excitation, emission} wavelengths of {550,600} nm. For the Y=100% sample we observe the signature feature of the yellow paint component near {450,515} nm.
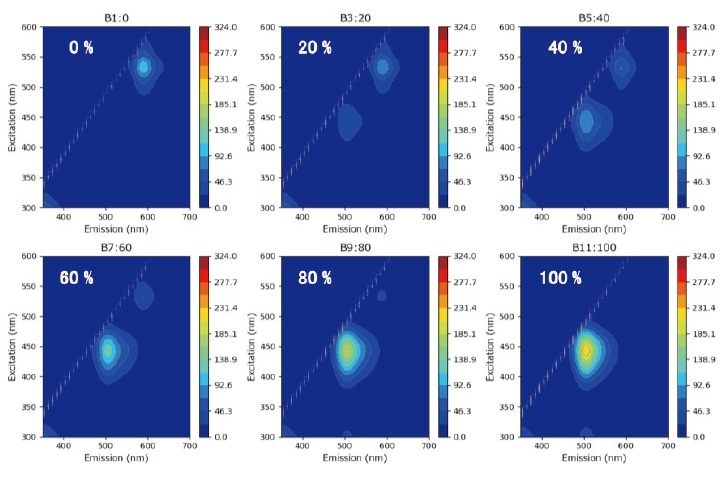
Fig. 5 Three-dimensional fluorescence spectra of blended fluorescent paint samples with various blend ratios.
Next, to estimate the blend ratios via LASSO analysis, we make 5 measurements for each sample (a total of 55 measurements), of which 3 data are used as calibration data in constructing the model and 2 data are used as validation data in testing the model (see Figure 6).
The LASSO algorithm constructs a predictive model by automatically extracting from a high-dimensional data set the feature points (wavelengths) that are most highly correlated to the data components (types, concentrations, etc.) that explain the features of the sample. In this case, each fluorescence fingerprint contains data for approximately 7,100 wavelengths; in the LASSO analysis this is reduced to a selection of 75 representative wavelengths for the estimation of blend ratios. The LASSO analysis in 3D SpectAlyze® allows the display to be configured to show excitation wavelengths, fluorescence wavelengths, and the coefficients of the extracted wavelengths as well as three-dimensional fluorescence spectra, yielding an intuitive visual depiction of the wavelengths most relevant to the analysis.
For each extracted wavelength, a coefficient is computed and a model formula is used to estimate the blend ratio. In validation tests using the known data from which the model was constructed, the correlation between the model's predictions and the true values was R2=0.9997, while for the data used to test the model the correlation was R2=0.9992, an excellent result indicating the high accuracy of the model.
Quantitative values are typically computed from calibration curves for a single wavelength. However, using LASSO or PLS analysis we can construct calibration curves for many wavelengths, increasing the accuracy of the computed results.
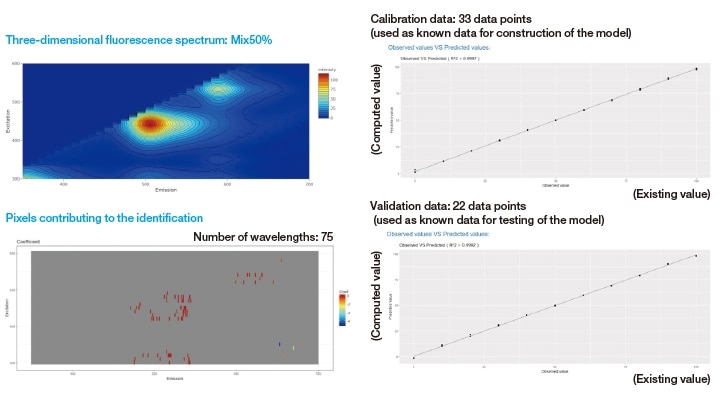
Fig. 6 LASSO estimates of blend ratios for fluorescent paint samples
With the performance of analytical instruments improving every day, it is increasingly possible to accumulate large quantities of information in a short period of time. A potential disadvantage of this development is the growing amount of time required to analyze this ocean of data—and it is here that multivariate analysis comes to the rescue, offering methods for making sense of enormous data sets in reasonable amounts of time. 3D SpectAlyze® is specifically designed to make these tools convenient and easy to use—a role whose importance will only grow in future years as the influence of multivariate analysis continues expanding into an ever-broader range of disciplines.
References
About the authors
*1 Takuya Sato, Chiaki Ito, Hitoshi Fujimiya
DYNACOM Co., Ltd.
*2 Jun Horigome, Hideyuki Sakamoto
Hitachi High-Tech Science Corporation
See more
