(Simultaneous Reflectance and Fluorescence Analyzer with Sample Imaging)
Jun Horigome
A fluorescence spectrophotometer is an instrument in which a sample is irradiated by monochromatic light— produced by using a prism, diffraction grating, or similar tool to separate white light—and the resulting fluorescence emissions are again separated into monochromatic components and detected to measure concentrations and properties of fluorescent substances.
Recent years have witnessed an increasing trend toward the miniaturization and fine-graining of fluorescent materials used for applications such as LED illumination and display devices, creating a growing need for higherprecision measurement techniques than have been available to date through the use of fluorescence spectrophotometers to characterize the performance and properties of electronic materials, industrial materials, and similar samples.
Our newly developed EEM® View fluorescent spectroscopic microscope combines an integrating sphere with a CMOS camera to yield the world’s first(*1) dedicated fluorescence spectrophotometer measurement system capable of simultaneously acquiring spectroscopic images and spectral data (Figure 1).
With the monochromatic light emitted by the fluorescence spectrophotometer serving as a light source, an integrating sphere is used to disperse the light to ensure uniform irradiation of the sample without clumping, and images captured by a CMOS camera are processed by a computational algorithm(*2) based on AI technology to enable separate displays of fluorescent-component and reflected-component images. In addition, it is possible to subdivide sample images into 25 sectors and acquire enlarged images and spectral fluorescence/reflection data for each individual subregion. Whereas conventional fluorescence spectrophotometers are limited to acquiring spatially-averaged spectral data for the sample as a whole, EEM® View allows visualization of reflection and fluorescence spectra—and acquisition of spectral data—from specific sample subregions, lending insight into the portions of samples responsible for fluorescence emissions and enabling higher-precision characterization of fluorescent substances.
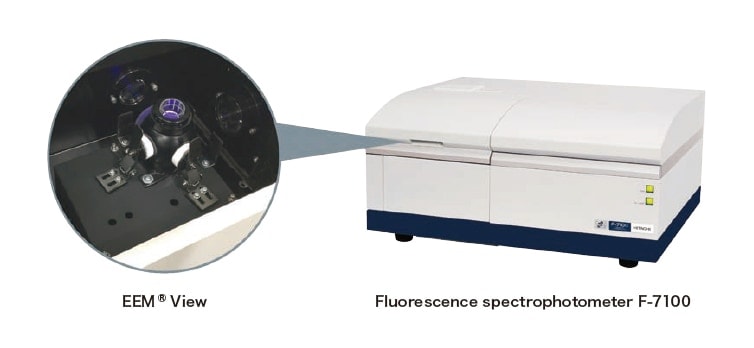
Fig. 1 Fluorescence Spectrophotometer with CMOS Camera System "EEM® View"
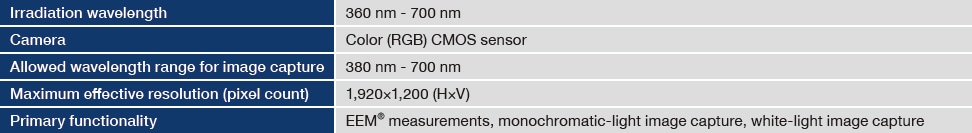
Key features:
Key specifications:
A dedicated analytical software suite allows data visualization and spectral analysis for sample images and threedimensional
fluorescence spectra acquired by the EEM® View (Figure 2). Selecting a dataset to view or analyze from the list of available files brings up a data visualization display. Available spectral data include three-dimensional fluorescence spectra and excitation or fluorescence spectra selected by the trace bar. Available image data include images captured for particular excitation wavelengths and galleries of thumbnail images. Selecting a thumbnail brings up an enlarged view of the image. Enlarged image displays may be subdivided into a 5×5 grid of subregions, and calculations of fluorescence and reflection spectra may be carried out for individual subregions. Selecting a subregion superposes spectral data for that subregion and shows a list of data for the wavelength selected by the trace bar.
As one example, Figure 2 shows a measurement of a fluorescent body mounted atop a white-light LED; brightness hotspots on the fluorescent body are discernible in the image and in the fluorescence spectrum.
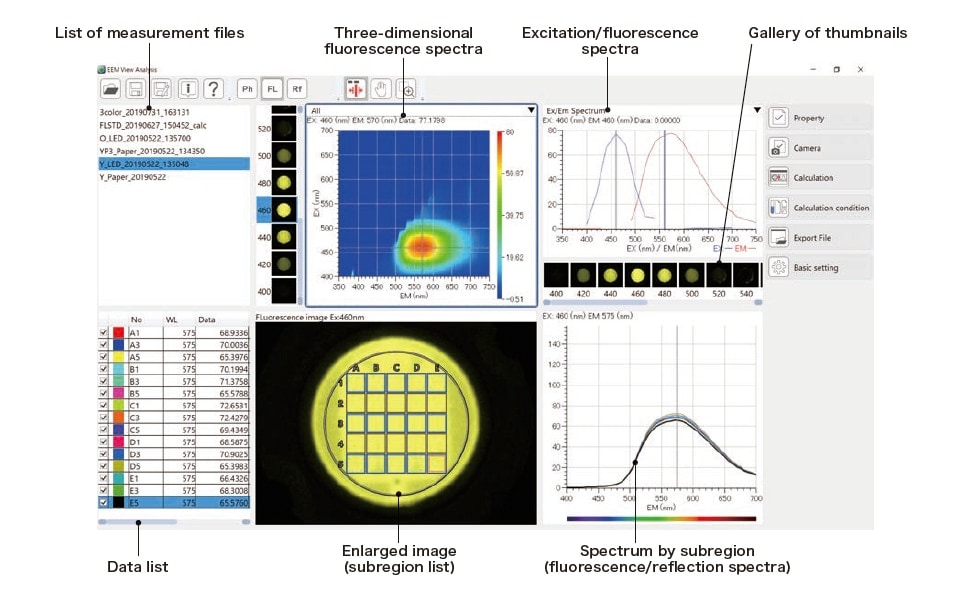
Fig. 2 EEM® View Analysis window
Figure 3 shows an illustrative measurement of a resin sheet coated by a fluorescent body for use in wall-mounted illumination with LED. In this example, we characterize the state of clumping and dispersion in the fluorescent body. Fluorescence properties of the sample were acquired with monochromatic light at irradiation wavelengths in the range 360-640 nm. In EEM® View mode, a sample image is also acquired for each set of irradiation conditions. We obtain images of the fluorescent-coated resin sheet under white-light illumination and apply a computational algorithm to yield separate images for reflected and fluorescent components. The separated image for fluorescent components allows observation of the state of the coating, with reflection and fluorescence spectra observed simultaneously.
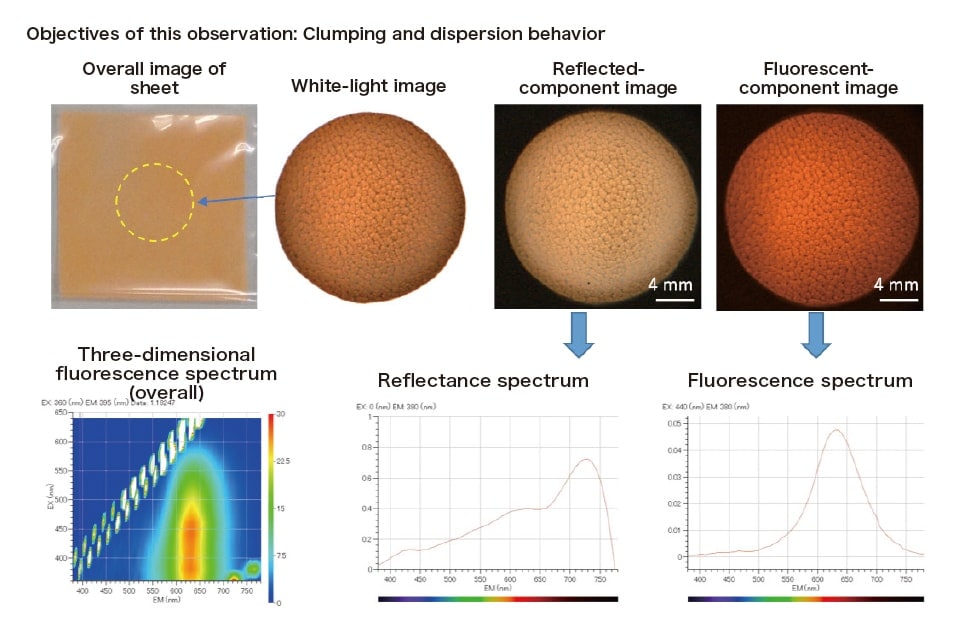
Fig. 3 Acquired image of sheet and spectra obtained via computational algorithm.
Figure 4 shows an example in which the coating state differs from region to region. Clumping of the coatant is visible in the separated fluorescent-component image. In addition, fluorescence spectra computed for individual subregions of the image may be used to characterize fluctuations in fluorescence intensity. In this case, images acquired for samples with discernible clumping exhibited high brightness near the center of the image. This is confirmed by spectral data, which indicate an increase in peak intensity of approximately 15%.
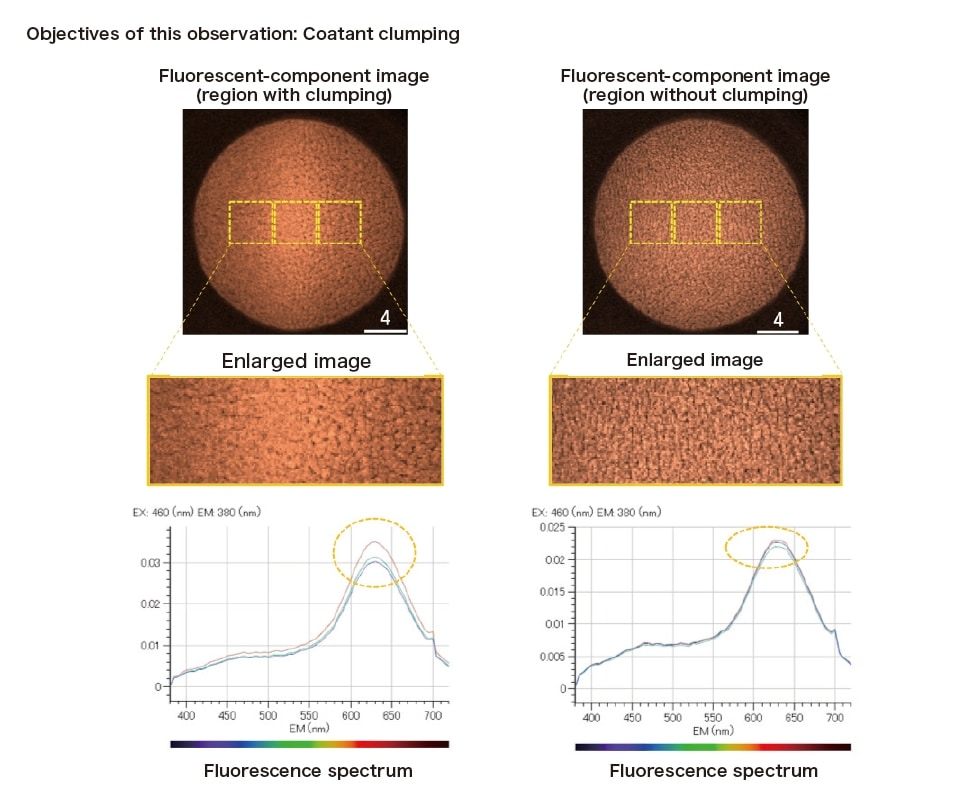
Fig. 4 Observation of coatant clumping in captured images and computed spectra for a fluorescent-coated resin sheet.
EEM® View may be installed for use with the F-7100 fluorescence spectrophotometer available from Hitachi High-Tech Science. The simultaneous ability to acquire spectral data and CMOS camera images separated into fluorescent and reflected components will be valuable for R&D and quality control of a broad range of products, including materials, pharmaceuticals, and foodstuffs, which require higher-precision measurement techniques.
Hitachi High-Tech Science is committed to advancing the use of EEM® View as a powerful fluorescence-analysis tool for R&D and quality control in a wide range of fields, including not only electronic and industrial materials for LEDs and display devices—an area in which the need for fine-grained measurement technologies is increasingly urgent—but also in areas such as food inspection, life sciences, and biotechnology.
About the author
Jun Horigome
Optics Design Department
Hitachi High-Tech Science Corporation
See more
