
From defect inspection
to support for reverse
engineering
Used for void
analysis, density analysis,
internal geometry
measurement and the
generation of 3D data
Hydrogen tanks for fuel cell vehicles (FCVs) equipped in hydrogen-fueled vehicles are made from advanced composite materials (CFRP layered materials), and to evaluate their safety, Hitachi's high-energy CT scanning systems are used for internal inspections.
The direct purpose of these internal inspections is to evaluate the state of inner damage or deformation after drop impact testing has been conducted on the hydrogen container.
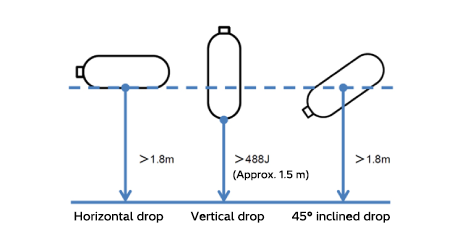
Figure 1 Overview of drop testing
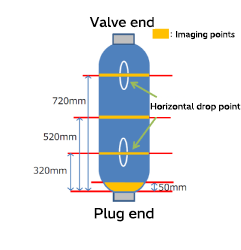
Figure 2 Sample imaging points
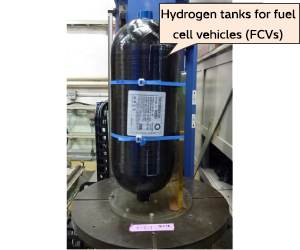
Figure 3 View of the sample in place for imaging
Figure 1 provides an overview of the different drop tests that are performed. The sample is dropped horizontally, vertically and at a 45° incline, after which the drop impact points indicated in orange in Figure 2 are CT imaged.
Figure 3 shows how the sample is put in place during CT scanning. The imaged hydrogen tank is 300 mm in diameter and over a meter long. The hydrogen cylinder is placed vertically, and a large number of CT images are taken parallel to the table surface. Using image processing, the individual images are layered to enable the three-dimensional inspection of the interior.
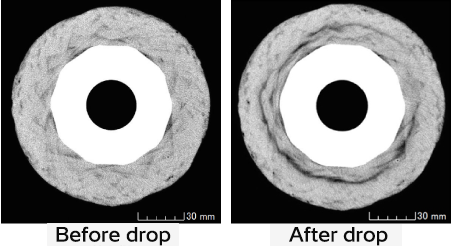
Figure 4 Examples of cross-sectional CT images before and after the sample was dropped
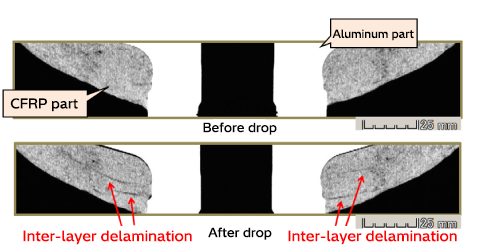
Figure 5 Examples of CT images of longitudinal cross sections before and after the sample was dropped
Figure 4 depicts cross-sectional CT images before and after dropping, while Figure 5 shows longitudinal cross-sectional images.
After dropping, black gaps are visible inside the CFRP laminate, suggesting that interlaminar delamination has occurred.
In addition, subsequent pressure cycle testing showed that the drop impact caused burst pressure to decline by 5%.
In this case, rather than cutting open a hydrogen cylinder after each test to inspect the interior, non-destructive testing is employed so that the same cylinder can be subjected to a battery of tests and evaluations, from dropping to pressure cycle. Additionally, through high-energy CT scanning, it was possible to observe the interior of the CFRP laminate materials without producing artifacts in the metal plug materials at the center.
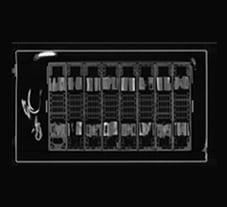
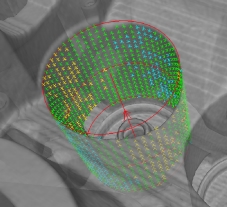
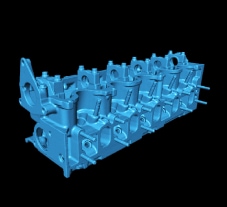
In this case, defects are visualized by observing the interior of an aluminum engine cylinder head. The approximate size of the cylinder head is 450 mm wide, 250 mm deep and 150 mm high.
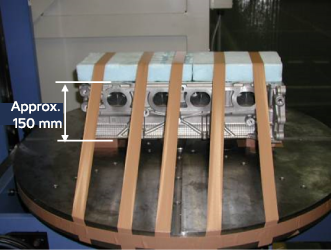
Figure 1 State of the cylinder head in place
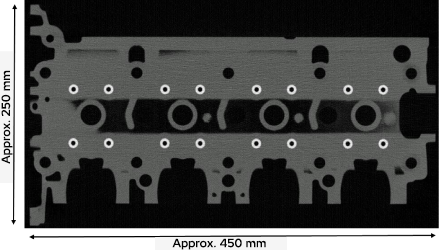
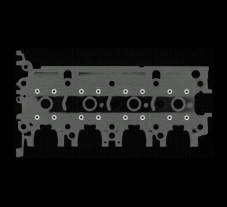
Figure 2 CT cross-sectional image of the cylinder head
As the CT system has high penetrability, the cylinder head is placed horizontally as shown in Figure 1, and 300 cross-sectional images at a 0.5 mm pitch are taken in the vertical direction to inspect the interior three-dimensionally with image processing.
Figure 2 shows an example of one of the cross-sectional images. The bright white circles correspond to high-density steel materials, while the other parts are aluminum. Due to the high-energy CT scanning, no artifacts are produced from the steel materials.
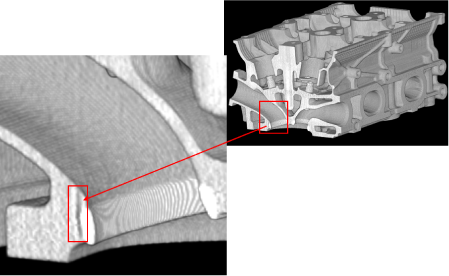
Figure 3 Visualization of leak locations (part 1)
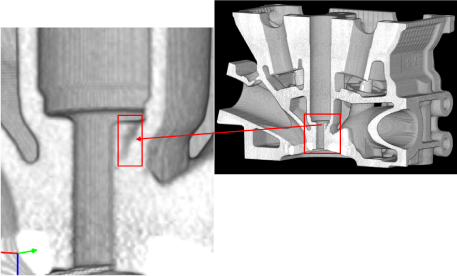
Figure 4 Visualization of leak locations (part 2)
Figures 3 and 4 show examples of how the locations of leaks are visualized using three-dimensional images. This allows the length and location of leaks to be determined, and helps operators estimate what caused the leaks.
In addition, since the position of a leak can be accurately identified, simple indicators can be obtained pointing to the location and direction of cuts that need to be made for destructive testing when performing a detailed analysis of what caused a leak.
Figure 1 shows an example of the analysis of casting defects (voids) inside an aluminum four-cylinder engine block. Although this engine block also incorporates parts made from steel, using a high-energy CT system with strong penetrability allows artifact-free CT cross-sectional images to be obtained. Figure 2 shows an example of the analysis of casting defects (voids) inside an aluminum wheel.
In both cases, a large number of CT cross-sectional images are taken to cover the entire sample, after which the internal defects are identified in three dimensions through image analysis. Information including the volume and coordinates of defects can be obtained. In the figure, the three-dimensional CT images are displayed with a semi-transparent view, with color-coded overlays based on the size (volume) of any identified defects.
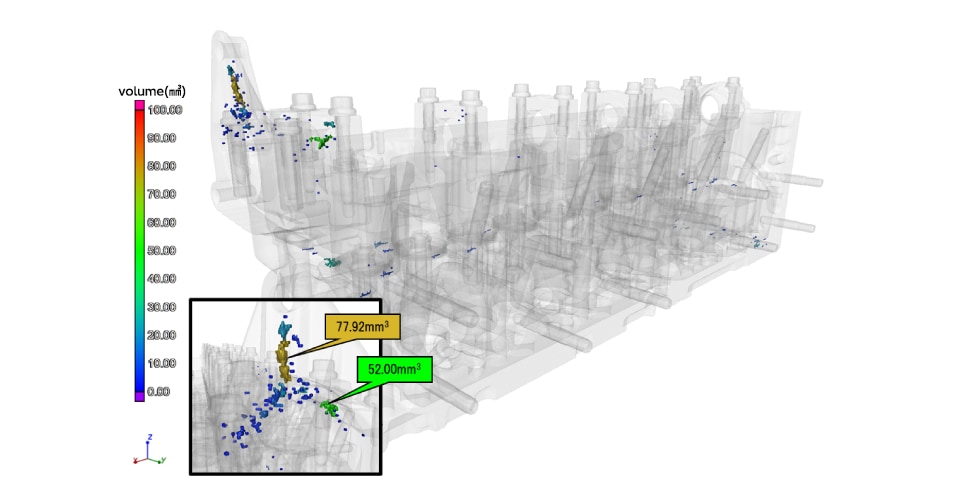
Figure 1 Void analysis of the interior of an engine block
With cast and die-cast pieces, shrinkage voids and cavities (referred to collectively as voids) can occur during the process where molten metal solidifies. The casting process needs to be examined to control the size and locations of these voids to ensure they do not occur at critical sizes and locations. By obtaining information (size and position) on the defects in actual pieces and integrating that insight with casting simulations, customers can improve their casting processes.
As the positions of voids can be accurately identified, simple indicators can be obtained pointing to the location and direction of cuts that need to be made for destructive testing when performing a detailed analysis of what caused a void.
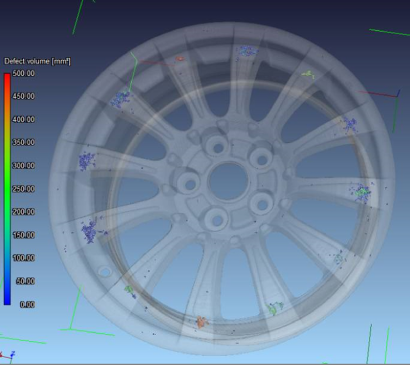
Figure 2 Void analysis of the interior of an aluminum wheel
In this example, CT images (cross-sectional images and three-dimensional images) are used for virtual geometry measurements. CT cross-sectional and three-dimensional images contain geometry information including the interior of the actual workpiece. This is an example of how that geometry information is extracted. As measurements can be made on the CT images, the shape and dimensions of the interior can also be measured—something that cannot be measured on an actual workpiece.
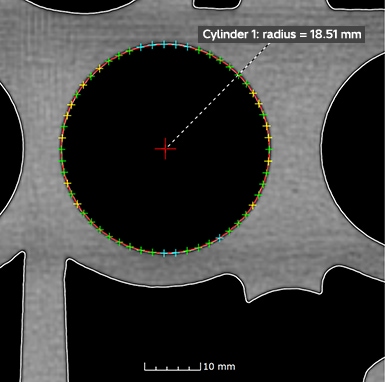
Figure 1 Example of two-dimensional measurement
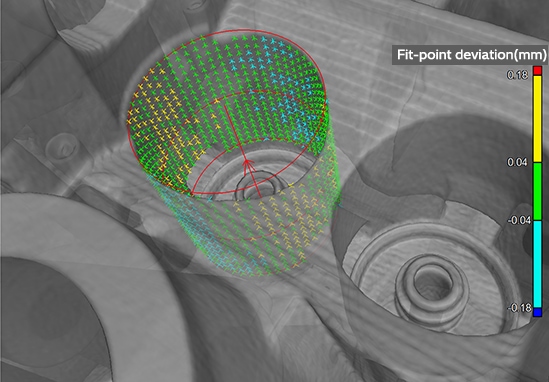
Figure 2 Example of three-dimensional measurement
Figures 1 and 2 are examples of geometry measurements performed on the port section of a cylinder head. In Figure 1, 2d circle measurement is performed on a cross-sectional image, while in Figure 2, 3D images are similarly used to measure the three-dimensional cylinder. In both cases, the surface of the port section is identified and fitted with a circle or cylinder to measure the central coordinates, radius and axial vector.
The accuracy of these geometry measurements is directly related to the precision with which the surface is identified. The less noise in CT images, the better the surface can be identified. This is an area where a high-energy CT system excels, as there are few artifacts produced due to metals, enabling high-powered X-rays to provide images with minimal noise.
In this example, basic geometric shapes such as circles and cylinders are used to take geometric measurements, but any point on a 2D or 3D image can be used to make a number of different measurements, including distance, angle and curvature. In another example, we have detailed comparative measurements for comparing an actual workpiece with its CAD equivalent. Please refer to them as well.
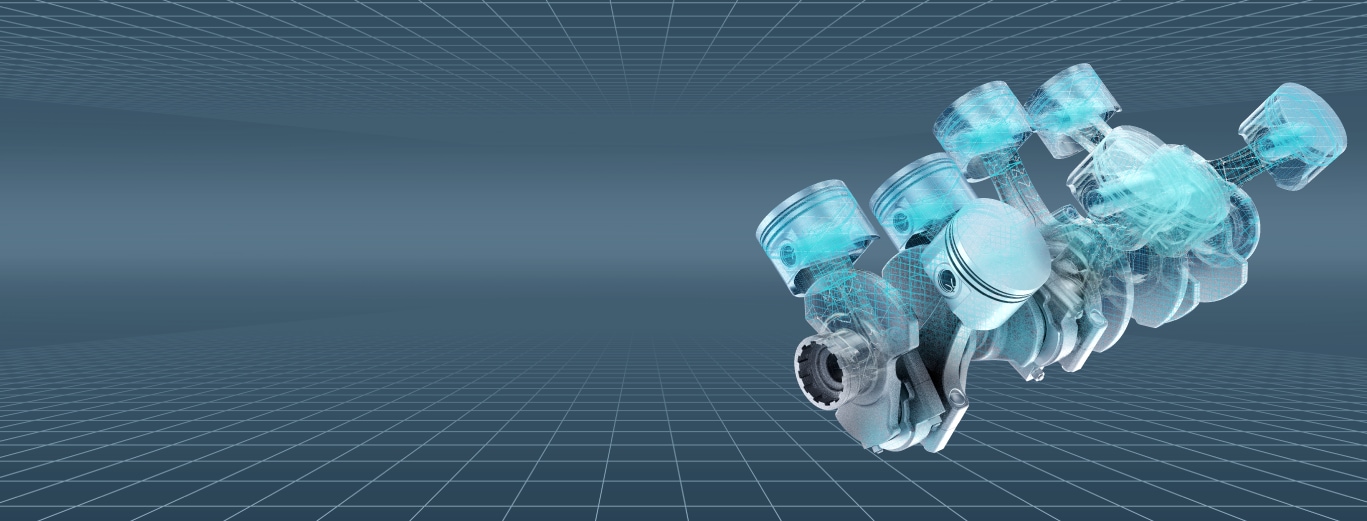
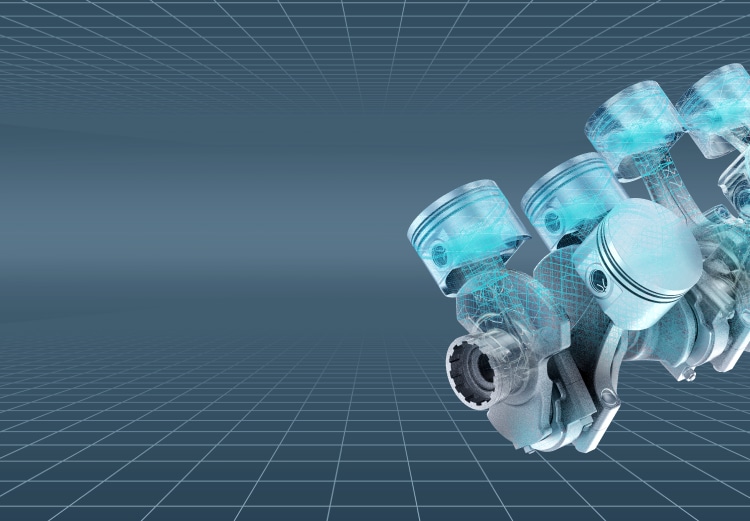
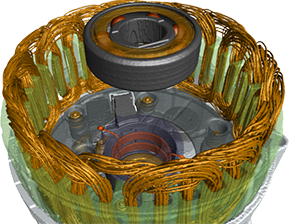
This is an example of the separation of components in an alternator (generator) equipped in a vehicle is determined using density analysis.
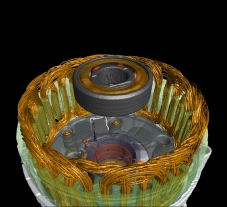
Figure 1 is a photo of the exterior of the alternator. In terms of size, the body section is 130 mm wide, and the overall height is 270 mm. As it is a type of generator, it consists of various composite materials, including steel coils (density: 8.9 g / cm³), steel magnets and cores (density: 7.8 g / cm³) and an aluminum case (density: 2.7 g / cm³).
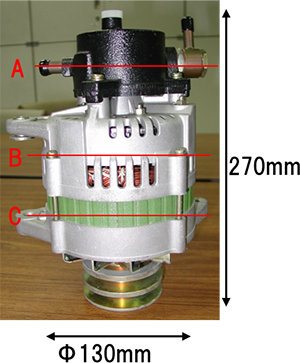
Figure 1 Image of the alternator exterior
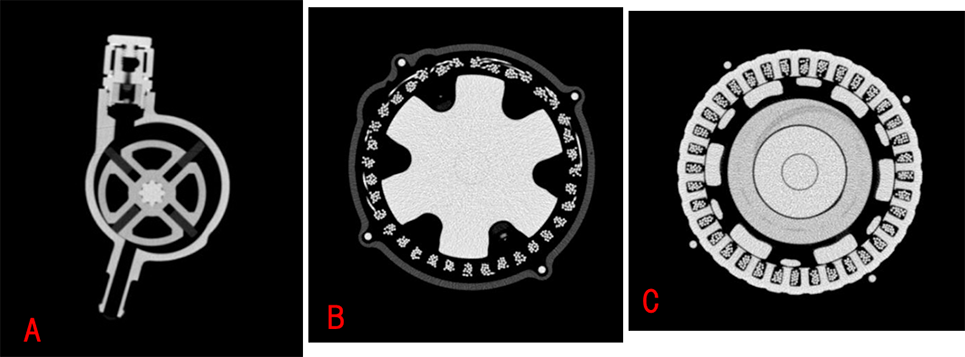
Figure 2 CT cross-sectional images of the alternator
Figure 2 shows examples of CT cross-sectional images. Darker and lighter shades indicate the difference in the material. These differences in shade are used to separate the components in the alternator to produce the examples shown in Figure 3 with color-coded components. There is independent volume data for each of the separated parts.
Half-section image
Split component image
Component selection image (coil section)
Figure 3 3D data with each component color-coded
Figure 3 shows examples of different 3D representations of the piece, including a half-section view, a longitudinal split view that separates the components, and an image focusing the display on the coil section.
As high dynamic range is one of the features of a high-energy CT system, various materials from low- to high-density can be captured in a single CT image.
It is possible to obtain 3D data from composite materials and assembled components that include high-density materials. This data can be used for Model Based Development (MBD), enabling CAE verification based on data from actual workpieces.
In this case, the ideal shape depicted in the design CAD model is compared against the shape of the actual workpiece. While dimensional measurements are linear measurements such as the distance between two points or the distances between surfaces, geometry measurements measure curved surfaces. In this example, the geometry of a pump impeller (turbine blade) is compared, visualizing whether the curved surface of the blade has been accurately produced by comparing with the design CAD model.
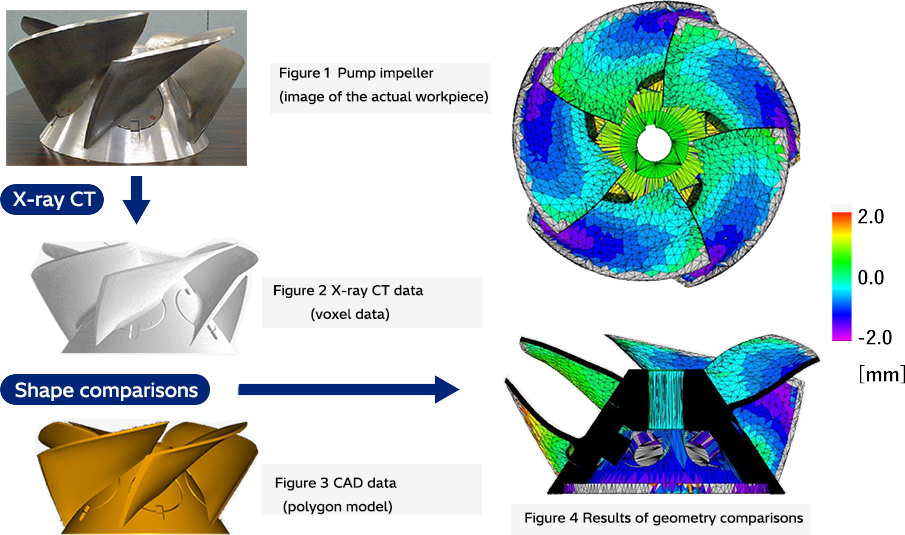
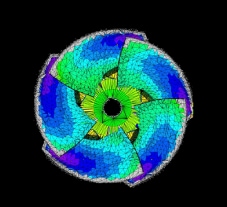
Figure 1 is an image of the pump impeller exterior. Five blades are mounted to a conical-shaped base, made from stainless steel.
Figure 2 shows voxel data produced from a 3D CT image captured with a high-energy CT scanner. Figure 3 shows the design CAD data for the pump impeller, converted into a polygon model describing the surface geometry from the solid model.
By comparing this actual workpiece data in Figure 2 (voxel data) with the design data (polygon model) in Figure 3, Figure 4 is produced to visualize the differences from the design data. This shows that all five of the blades are more recessed (shown in blue) compared with the design data at the lower sections. This suggests that there is a mismatch in how the blades are mounted to the base.
This application measures (compares) the shapes of the blades rather than measuring dimensional data such as blade thickness. By depicting differences using a color map, it is possible to quantitatively evaluate to what extent the curved surfaces in an actual workpiece diverge from the design, and where the differences are the greatest. Those results can be fed back into the manufacturing process to ensure reliability.
These are examples of CAE integration using data on actual workpieces obtained through X-ray CT scanning.
The first is an example of integration with casting simulation. Void defects are analyzed based on CT data, and those results are fed back into the casting simulation to improve the calculations performed by the casting simulation.
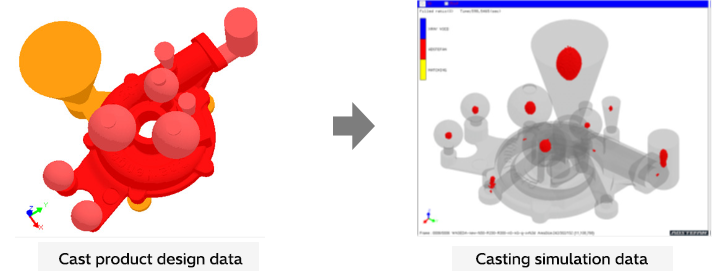
Figure 1
First, a casting simulation is performed to determine where voids will form and to what extent (Figure 1). The areas marked in red in Figure 1 are where voids are expected to form.
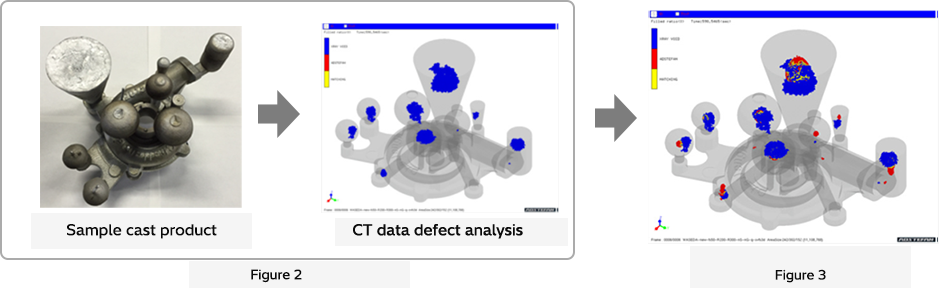
Next, the actual cast product is CT imaged to perform a void defect analysis (Figure 2). The areas marked in blue in Figure 2 show the locations where voids have formed. By overlaying both data sets (Figure 3), it is possible to quantitatively assess the differences between the expected and actual results. When a difference occurs, the insight can be fed back into different processes, for instance to determine whether the cause was incorrect parameters during the simulation, or the casting production line not working according to the parameters. This approach improves casting quality in an efficient and speedy way, rather than assigning a large number of parameters to run simulations and repeatedly perform destructive testing on numerous prototypes.
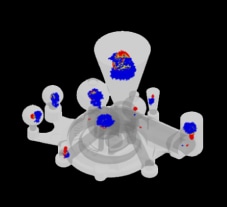
The second example is a fluid analysis based on an actual model. An actual projector (Figure 4) is CT scanned to create voxel data as a three-dimensional image (Figure 5).
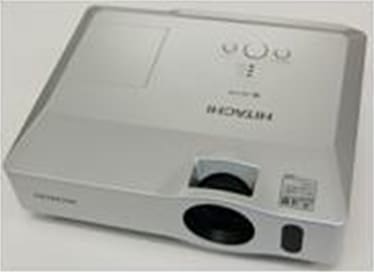
Figure 4
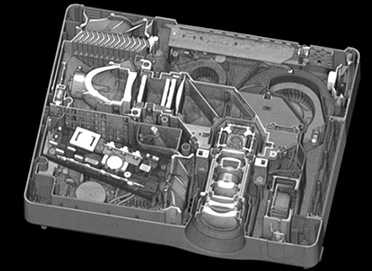
Figure 5
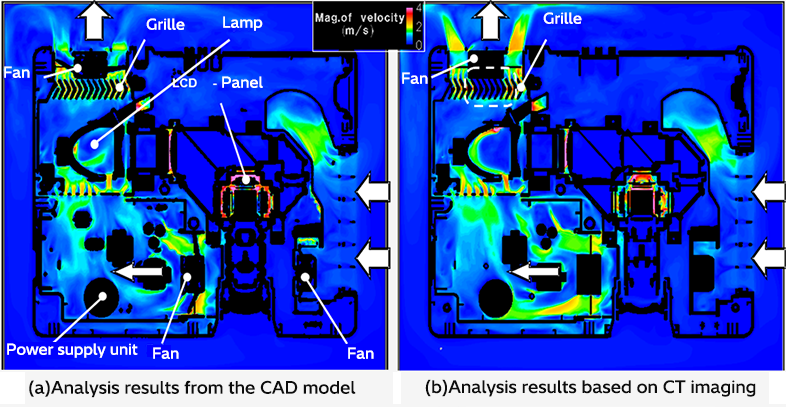
Figure 6
Using this data, the airflow from the air intake port to the exhaust port is analyzed (Figure 6). When the calculations from the CAD model (left side of Figure 6) and calculations from the actual model (right side of Figure 6) are compared, significant differences in airflow through the exhaust port can be seen. This is because in the final line of the projector production process, workers adjust the grille to ensure proper airflow out from the exhaust port. In this way, it is possible to analyze phenomena that are actually occurring through CAE that uses actual products or workpieces.
Three-dimensional data from an actual item obtained through X-ray CT scanning is referred to as voxel data. Voxel data is a collection of small hexahedral shapes known as voxels, with each voxel storing a CT value.
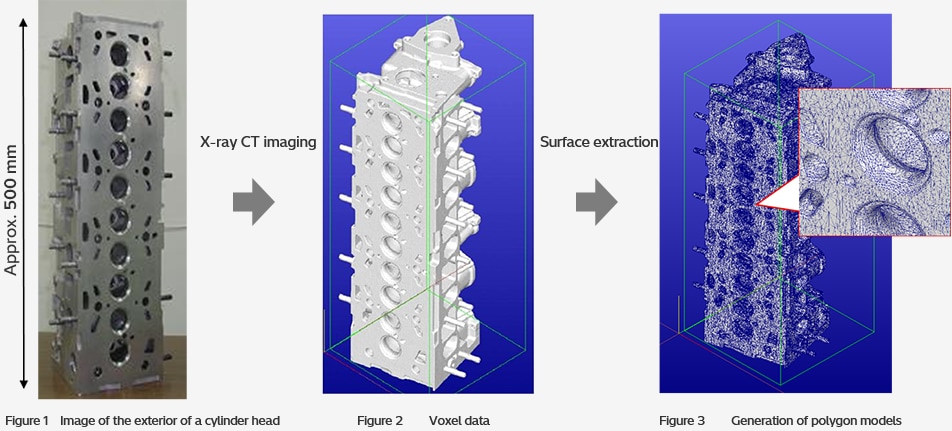
The first example involves the creation of a polygon model. An actual cylinder head (Figure 1) is X-ray CT scanned to obtain 3D voxel data (Figure 2). Based on this voxel data, the surface geometry is extracted, and the surfaces of the object are filled in with triangles to create a polygon model (Figure 3). A polygon model is one that can be used by 3D printers and CG (computer graphics) applications. This polygon model only contains information on the points that make up surfaces and lines that connect those points. The insides are hollow, and density information from the actual object is lost.
The next example involves creating a solid model from a polygon model.
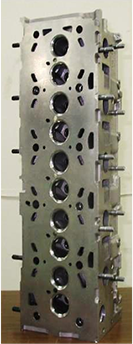
Figure 4 Image of the exterior of a cylinder head
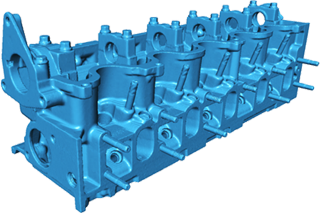
Figure 5 Generation of polygon models
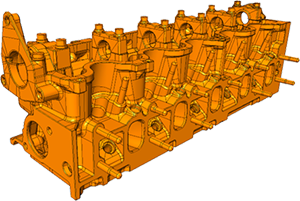
Figure 6 Solid model
In the same way, the actual cylinder head (Figure 4) is X-ray CT scanned to obtain 3D voxel data, and then a polygon model is created (Figure 5). The point cloud that makes up this polygon model is turned into a solid model (Figure 6) by converting it into mathematical functions such as planes or NURBS curves in a process sometimes referred to as "B-reps* conversion" or "surface patching." While a polygon model cannot be subjected to topological operations such as shape deformation, this is possible with a solid model, and also simplifies integration with existing CAE software. However, conversion into a solid model involves many manual operations performed by a software operator, and the model conversion process takes a lot of time.
Finally, applications of voxel data captured with X-ray CT scanning are summarized in the figure below. The data is utilized in three main computational models: (1) directly using the voxel data, (2) using the data after conversion into a polygon model, and (3) using the data after creating a solid model.
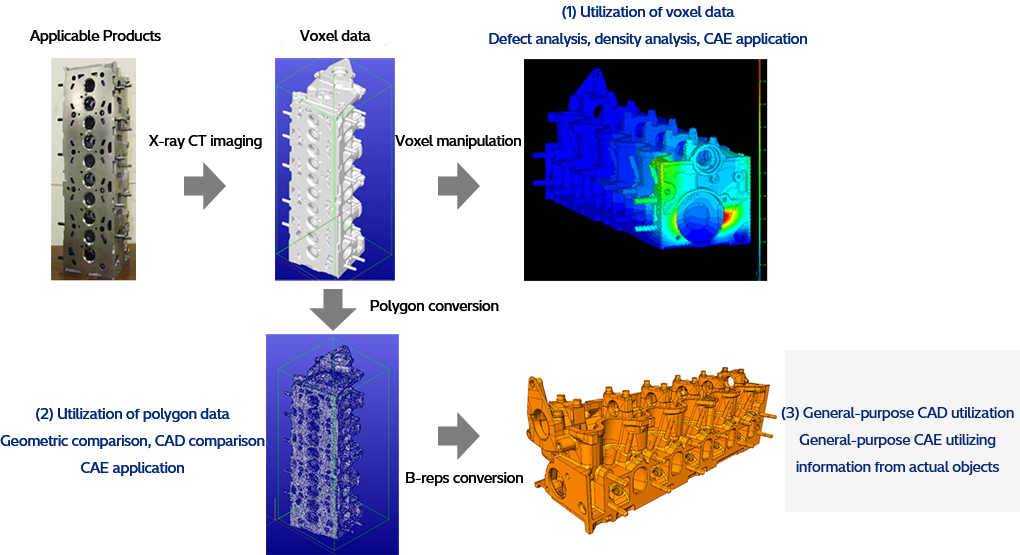
The computational models used vary depending on how the data from the actual object will be utilized, what software will be used, the length of the utilization lead time, and other factors. In addition, when the data is converted into a computational model, there are also processes related to the data conversion, such as noise removal, artifact removal and reduction of data volume. Caution is required, as these processes can impact the quality of the computational models.

This section introduces the features of Hitachi High-Tech's high energy X-ray CT systems.
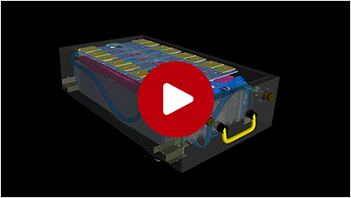
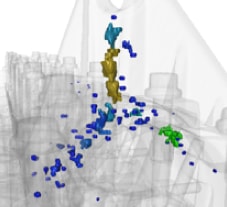
This is a generated 3D image of an e-axle and lithium-ion battery pack.
Sign up to view the two materials described above.