
Susumu Shimoyama
PhD*1
Color Materials Science Laboratory, Den Material Company Ltd.
Professor Emeritus, Kibi International University
Cultural properties are precious assets that furnish living, breathing witness to history and heritage. For this reason, scientific studies of cultural properties must rely exclusively on non-destructive analytical techniques, avoiding any chemical or physical processing steps that may risk damaging precious artifacts. In this article we focus in particular on the colorants used in cultural properties such as Ryukyuan bingata garments, lacquerware, ceramic pottery, Nihonga paintings, oil paintings, and ukiyo-e woodblock prints. We describe an experimental technique—including both analytical instruments for on-site measurements and methods for processing the information they provide—for analyzing such colorants non-destructively. This technique, which has been used extensively for practical field work, involves a multi-stage procedure for non-destructive analysis of colorants in cultural properties. We begin by taking infrared photographs to determine the infrared absorption properties of the colorants. Then we select points at which to make measurements and capture microscopy images at these points to yield enlarged views of the coloration states. Next, we obtain visible/near-infrared reflection spectra at different measurement points and use the shape of these spectra to analyze the colorants. Finally, we measure X-ray fluorescence (XRF) spectra and attempt to use the resulting elemental analysis data to identify pigments; when pigments cannot be identified in this way, we measure threedimensional fluorescence (3DF) spectra and use the results to identify dyes.
Our infrared photography setup is shown in Figure 1. We use a PENTAX 645D IR camera (effective pixel count: approximately 40 million pixels) equipped with an smcPENTAX-FA645 75 mm F2.8 lens. As light sources we use two Canon SPEEDLITE 420EX flash units with stroboscopic capabilities. On both the front surface of the camera lens and the light-emitting surfaces of the flash units we install IR-86 filters (a sharp-cutoff filter from Fuji Film that transmits infrared wavelengths of 860 nm or longer). We use a wireless remote-flash controller (NEEWER), triggered by the camera with receivers on both flash units, to synchronize the flash units with the shutter. This setup allows us to capture clear images with no need to operate in darkened surroundings: The flash units irradiate the sample surface with infrared light at wavelengths longer than 860 nm, and light reflected from the sample is received by the camera and recorded to yield digital images. Note that we removed the band-pass filter that is usually installed inside the camera to eliminate ultraviolet and infrared wavelengths and transmit only visible light.
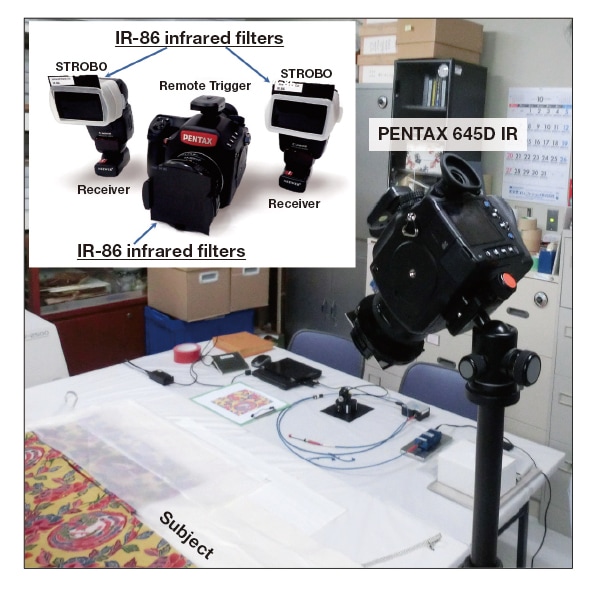
Fig. 1 Setup for infrared photography.
Table 1 Behavior of colorants (pigments, metals, and dyes) in infrared photographs.
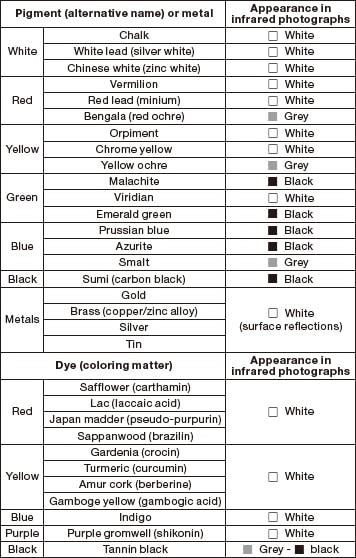
The longer wavelengths of infrared light compared to visible light ensure that infrared light is not reflected from the surfaces of material bodies—as is visible light—but instead penetrates into the body interior. For example, if the colorants in a bingata garment transmit infrared light without absorption, the light penetrates to deeper layers of the garment before eventually being reflected from the surface of fibers such as silk, cotton, or hemp; note that the reflected light passes through the colorant a second time as it exits the garment. Thus, when a colorant with high infrared transmittance is irradiated with infrared light for a photograph, the light is reflected at fiber surfaces and passes through the colorant a second time as it exits the sample to be captured and recorded by the camera, yielding white regions in captured images. In contrast, if the sample contains colorants that strongly absorb infrared radiation, incident infrared light is absorbed by the colorants before it can penetrate deeper into the material; in this case the light does not reach the fiber surfaces and is thus not reflected back toward the camera, yielding dark regions in captured images. Intermediate between these extremes are colorants with moderate infrared transmittance; in this case, only the transmitted portion of the incident radiation proceeds deeper into the sample to be reflected at fiber surfaces, yielding a lower-intensity reflected signal that produces grey regions in infrared photographs. Also, beneath high-transmittance colorants there may exist written characters or line drawings marked in sumi ink (or charcoal); although these are not visible by eye, they appear as dark regions in infrared photographs. In bingata garments and similar samples, ultra-fine ink lines drawn by hand on infrared-transmitting colorants appear as dark lines in infrared photographs. This is due to the fact that the ink used, which consists primarily of carbon, exhibits high infrared absorbance. Colorants (pigments, metals, and dyes) appearing as white, black, or grey regions of infrared photographs are listed in Table 1.
When sketches beneath oil paintings are drawn in charcoal (carbon), it is well known that these sketches may be seen in infrared photographs. In fact, this phenomenon is not limited to charcoal, but also applies to infrared-absorbing Prussian blue, as we confirmed by using a HORIBA XGT (X-ray Guide Tube)-5000 X-ray analytical microscope to carry out an elemental-mapping analysis of "Daubigny's Garden"—one of the best-known oil paintings of van Gogh's final years, held by the Hiroshima Museum of Art (dimensions: 530 mm tall × 1030 mm wide)—to determine whether or not a black cat, said to be drawn by van Gogh himself, was present behind the grass (that is, underneath the paint used to depict the grass) in the lower-left portion of the painting (Figure 2)2,3). To this day, the black cat remains hidden by brush strokes added by an unknown third party.
In this case, we cannot conduct experiments on the actual cultural property itself. Thus, when a preliminary investigation is required we perform experiments on models that we fabricate ourselves. For the analysis of Figure 2, we used a model of van Gogh's painting to test whether or not our elemental-mapping analysis could successfully identify a black cat hidden beneath the paint layers. This model was constructed by painter Hiroshi Yoshida, who prepared a facsimile—using the same paints van Gogh is thought to have used—of the region of the painting believed to be hiding the black-cat drawing. Yoshida began by blending Prussian blue with chrome yellow to yield "chrome green," then added more Prussian blue to yield a dark blue—nearly black—hue with which he painted a black cat (Figure 3A). Next, using colors thought to be used by van Gogh—primarily zinc white with some silver white, and with chrome yellow as a yellow hue and viridian and emerald green as green hues—Yoshida painted over the black cat to replicate the appearance of the grass in the van Gogh original, superposing multiple grains of grassy textures on top of each other until the black cat was hidden (Figure 3B). Finally, on top of this Yoshida added additional strokes of red ochre—as the unknown third party is believed to have used—to complete the preparation of our model painting4).
Figure 3C shows an infrared photograph of the model painting. Two of the paints used to prepare the facsimile— Prussian blue and emerald green—are infrared-absorbing and thus appear as black regions in the photograph. Of the other paints, zinc white, silver white, chrome yellow, and viridian appear as white regions, while red ochre appears as grey. Although infrared-absorbing emerald green is present at points scattered throughout the grass in the painting, the black cat appears to be drawn primarily in Prussian blue. This is why the cat is visible in the infrared photograph despite being hidden beneath paint layers depicting the grass. This demonstrates the ability of infrared photography to reveal features drawn in charcoal or other infrared-absorbing substances hidden beneath paint layers.
Unfortunately, our infrared photographs of the original "Daubigny's Garden" did not reveal a black cat; we attribute this to the thickness of the paint layers being greater than we had anticipated. However, an elemental-mapping analysis based on scanning X-ray fluorescence (XRF) measurements—performed on-site (in a temporary laboratory set up at the museum) using an X-ray analytical microscope (Figure 4)—revealed, in the mapping image for elemental chrome, drawings outlining the head, neck, front paws, torso, and tail of a cat, thus confirming that van Gogh did in fact draw a black cat beneath his masterpiece.
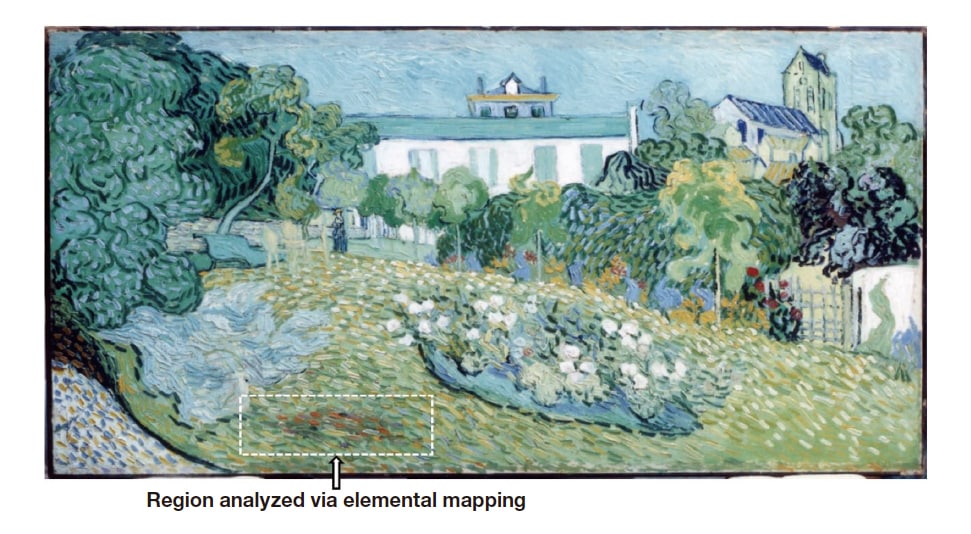
Fig. 2 Location of black cat hidden beneath van Gogh's "Daubigny's Garden".
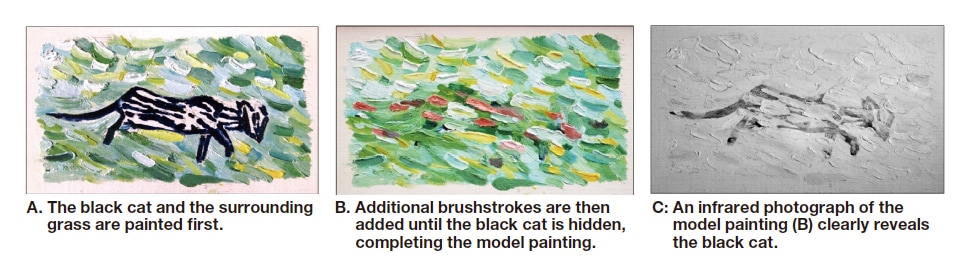
Fig. 3 Model painting prepared to reproduce portion of "Daubigny's Garden" (A, B) and infrared photograph of this model painting (C).
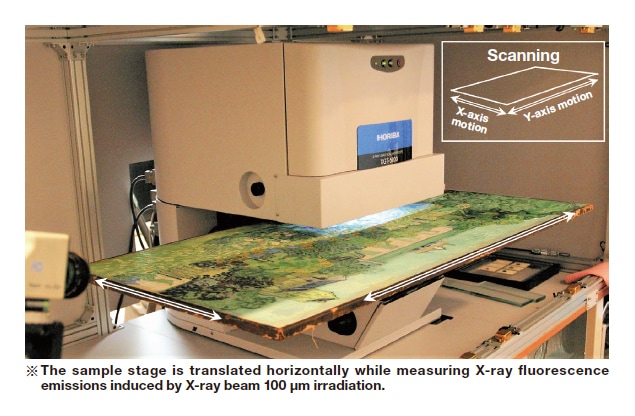
Fig. 4 Original "Daubigny's Garden" mounted in X-ray analytical microscope for scanning X-ray fluorescence measurements.
Figure 5 shows standard and infrared photographs of a bingata garment*2. With the exception of the black tanninbased mordant used as a black dye, most of the dyes, metals, and pigments used in this garment—including the chalk (Oyster Shell White) and white lead used as white pigments, vermilion and red lead used as red pigments, and orpiment used as a yellow pigment—are infrared-transmitting and appear as white regions in the infrared photograph. The garment also contains some colorants that are infrared-absorbing and appear as black regions in the infrared photograph—including malachite and emerald green for green coloring, Prussian blue and azurite for blue coloring, and sumi ink for black coloring—as well as some colorants that are partially infrared-absorbing and appear as grey regions in the infrared photograph, including Bengala, which contains iron oxide, for red coloring, yellow ochre for yellow coloring, and smalt (smalt mineral glass) for blue coloring. This demonstrates how white, black, and grey features in infrared photographs can be used to narrow down the list of candidates for the colorants that may be present in a specimen. This information, in combination with information obtained by other non-destructive analytical methods, can often be used to identify these colorants precisely.
For example, comparing the color photograph on the left with the infrared photograph on the right in Figure 5, we see that the base yellow color of the garment corresponds to white regions in the infrared image, while the blue and green tail feathers of the Chinese phoenix correspond to black regions. From this we infer, first, that the yellow base color of the garment is due either to orpiment (As2S3) or to yellow dye, as these two colorants appear white in infrared photographs. If XRF spectral measurements, discussed below, detect the presence of arsenic (As), we conclude the garment contains orpiment. On the other hand, if the XRF spectra do not suffice to settle the question, we measure 3DF spectra and identify the dyes present from the unique fluorescence fingerprints of their molecular structures.
Next, because the blue portions of tail feathers in the garment appear as black regions in the infrared photograph, we infer that the blue colorant is either Prussian blue (KFe[Fe(CN)6]3・nH2O) or azurite (Cu3(CO3)2(OH)2). If XRF spectral measurements detect iron (Fe), we conclude that it is the former; if XRF measurements detect copper (Cu), we conclude that it is the latter.
Finally, because the green portions of tail feathers in the garment appear as black regions in the infrared photograph, we hypothesize that the green colorant is malachite (basic copper carbonate CuCO3・Cu(OH)2). This will be confirmed if a subsequent XRF detects the presence of Cu.
Actually, at this point we pause to mention one insight gleaned from the many bingata specimens we have nondestructively a nalyzed thus far: in general, azurite and malachite are never used to yield color features in bingata garments. The reason for this is that, when a brush is used to apply a pigment to fabric (fibers), large pigment particles fail to become thoroughly embedded among the cloth fibers, and the fabric does not retain the intended color. Thus, the colorants used to brush patterns onto bingata garments must be pigments containing fine particles and yielding vivid colors. However, although both azurite and malachite produce deep and vivid colors when used as large particles, when used as small particles they yield only mild "whitish" colors typically known as "whitish-blue" and "whitish-green." Consequently, green features in bingata garments are typically produced by combining Prussian blue—which yields a vivid blue color even as small particles—with orpiment, which yields a vivid yellow color. In the case of Figure 5, the presence of Prussian blue in green regions causes these regions to appear black in infrared photographs. This is confirmed by the XRF spectral measurements discussed below, in which green regions of garments are found to contain both Fe (in Prussian blue) and As (contained in orpiment), but not Cu (in azurite and malachite).
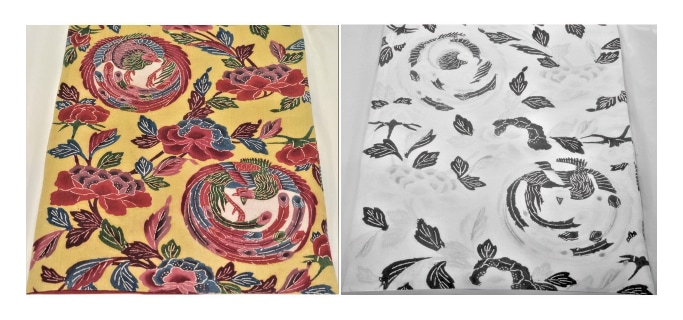
Fig. 5 Standard color photograph (left) and infrared photograph (right) of bingata garment.
To capture microscopy images, we use a PENTAX WG-3 camera (lens focal length: 4.5-18.0 mm, aperture range F2.0(W) - F4.9(T), effective pixel count: a pproximately 16 million pixels) e quipped with a micro-stand ring. As shown in Figure 6, for microscopy images of bingata garments we place a protective sheet—from which is cut out a circular hole the size of the camera lens—on the garment specimen, then place the camera on this sheet with its lens aligned in the hole. (The weight of the camera, including batteries and SD card, is 247 grams). Then, referring to the camera monitor, we move the camera until the image is centered on one of the predetermined measurement points, set the optical magnification to digital microscopy mode and capture images via remote control. The available optical magnifications are 1.2×, 2.5×, and a maximum of 4.0×, and the image data captured for each magnification can be viewed on a PC.
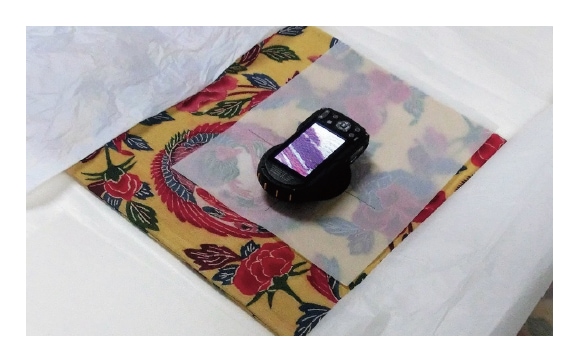
Fig. 6 Setup for capturing microscopy images.
Microscopy images of bingata garments present enlarged views of the colorants used for the base color and for accent colors in the fiber structures selected as measurement points. If these colorants are dyes, then the images allow us to observe transparent dyes for chromatic colors penetrating into the interior of fibers to achieve coloration, and also to observe the structural composition of the fabric. On the other hand, if the colorants are pigments, then we observe nontransparent colorants affixed to the surfaces of fibers; in this case, there will be defect regions, through which the base fibers will appear as white regions in microscopy images. For example, Figure 7 shows a microscopy image (optical magnification 4.0×) of red flower petals within a peony pattern formed on a bingata specimen. The image reveals non-transparent red colorants affixed to fiber surfaces; small defect regions, in which the colorants have peeled away or detached, appear white. From this we conclude that flower petals in the peony pattern were formed using a red pigment. Note that these red areas will appear as white regions in infrared photographs; visible/near-infrared reflection spectra, discussed below, reveal spectral shapes similar to that for vermilion in Figure 9A, while XRF spectra, also discussed below, indicate the presence of mercury (Hg). From these findings we conclude that the red coloration seen in the microscopy image on Figure 7 is due to particles of the pigment vermilion (HgS) affixed to fabric fibers.
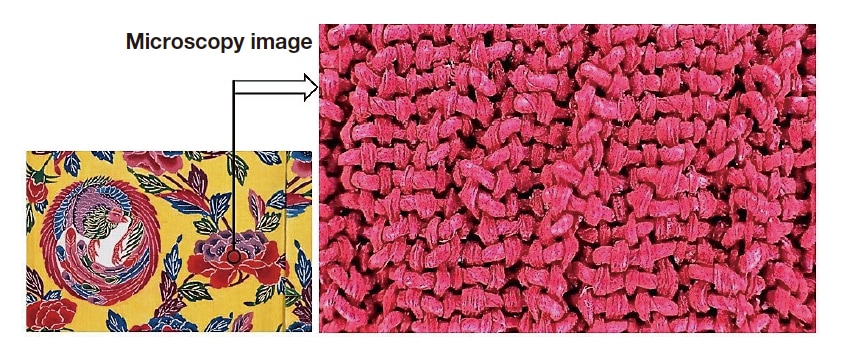
Fig. 7 Microscopy image of red flower petals in peony pattern formed on bingata garment.
Our setup for measuring visible/near-infrared reflection spectra is shown in Figure 8. We use a two-branch fiberoptic cable, (R400-7-VIS-NIR, Ocean Optics USA), connected at one end to a light source (LS-1 tungsten halogen lamp, Ocean Optics USA) and at the other end to a miniature multichannel spectrometer (USB4000, Ocean Optics USA). For example, to measure visible/near-infrared reflection spectra for a bingata specimen, we place a protective sheet—from which is cut out a circular hole—on top of the specimen, positioned with its hole centered on a preselected measurement point, and then place a light-blocking box (390 g), into which is inserted the end of the optical fiber, on top of the sheet. Next, we look through the view portal of the light-blocking box and make fine adjustments to ensure that light from the optical fiber is irradiating the vicinity of the preselected measurement point; we maintain a distance of approximately 3 mm from the end of the cable to the specimen surface, yielding a spot diameter of 1 mm irradiated by light with wavelengths ranging from the visible to the near-infrared region (380-1000 nm). Light reflected from the specimen is then carried by the other branch of the optical fiber to the spectrometer, where it is subdivided by wavelength to yield a visible/near-infrared reflection spectrum—that is, a curve plotting spectral reflectance vs. wavelength from the visible to the near-infrared region—which is displayed on a PC. Note that this setup can also be used without the light-blocking box: with the optical-fiber tip positioned approximately 3 mm from the preselected measurement point, reflected light is immediately captured and indicated on the PC display, allowing non-destructive measurement of visible/near-infrared reflection spectra. We have used this approach to measure large numbers of woodblock prints in a short period of time, as discussed below in the section Identifying blue colorants used in ukiyo-e woodblock prints.
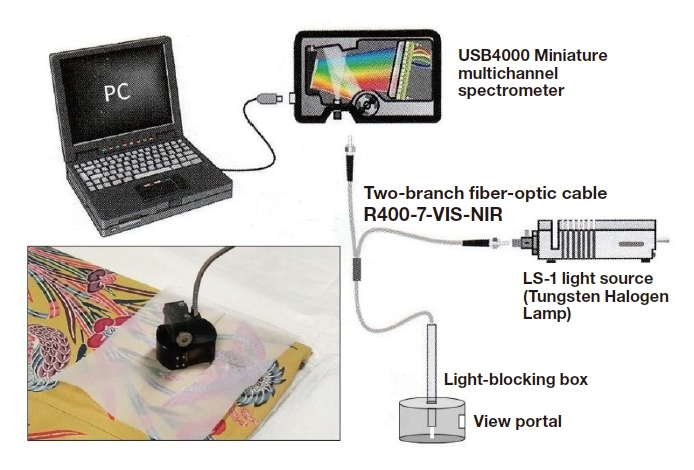
Fig. 8 Setup for measuring visible/near-infrared reflection spectra.
The visible/near-infrared reflection spectrum of a body plots the reflectance of the body (in units of percent) on the vertical axis vs. wavelength (in units of nanometers) on the horizontal axis. This yields a curve indicating how the body's reflectance varies with wavelength over the visible (380-700 nm) and near-infrared (700-1000 nm) regions. The visible-light portion of this curve contains information on the hue, brightness, and color intensity of colorants in the specimen, while the full curve spanning the visible and near-infrared regions contains information on the physical properties of the specimen. It is often possible to distinguish distinct colorants from the unique shapes of their spectra over this broad wavelength range, even if the colorant substances appear to be identical in color when viewed with the naked eye. Visible/near-infrared reflection spectra for some common colorants are shown in Figures 9-11.
Looking first at the spectrum of the pigment vermilion in Figure 9A, we see that the reflectance is low for short wavelengths, but begins to rise rapidly around 600 nm—a visible wavelength that the human eye recognizes as red—and remains high as the wavelength increases into the near-infrared region. Similarly, in the spectra of the iron-oxidebased pigments Bengala and yellow ochre in Figure 9B, we see characteristic absorption features near 655 nm in the visible region, and near 870 nm in the near-infrared region. Next, in the spectrum in Figure 10C for the pigment smalt we see a characteristic peak indicating a slight increase in reflectance near 565 nm in the visible region. In the spectrum in Figure 11B for the dye lac we see the reflectance increase rapidly near the 600 nm wavelength of red; and although this behavior is similar to that seen in the spectrum of the pigment vermilion (Figure 9A), the spectrum in Figure 11B is distinguished by a characteristic peak indicating a slight increase in reflectance near 545 nm in the visible region. Finally, in the spectrum in Figure 11C for the dye indigo, we see a characteristic spectral shape including a reflectance peak near the visible wavelength of 420 nm—interpreted by the human eye as blue—and a rapid increase in reflectance as we enter the near-infrared region beyond 700 nm. As these examples demonstrate, many varieties of colorants—including the red pigment Bengala, the yellow pigment yellow ochre, the blue pigment smalt, and the red dye lac—can be identified from the characteristic shapes of their reflection spectra.
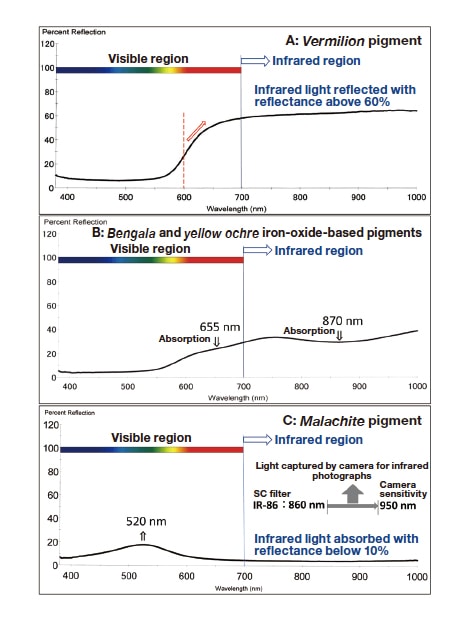
Fig. 9 Visible/near-infrared reflection spectra of vermilion (A), iron-oxide-based pigments Bengala and yellow ochre (B), and malachite (C).
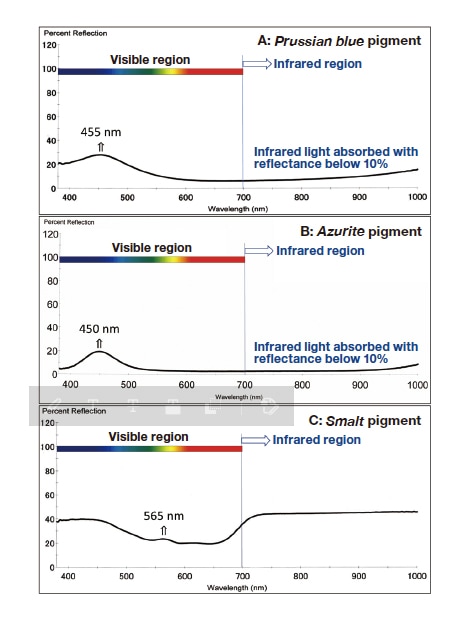
Fig. 10 Visible/near-infrared reflection spectra of Prussian blue (A), azurite (B), and smalt (C).
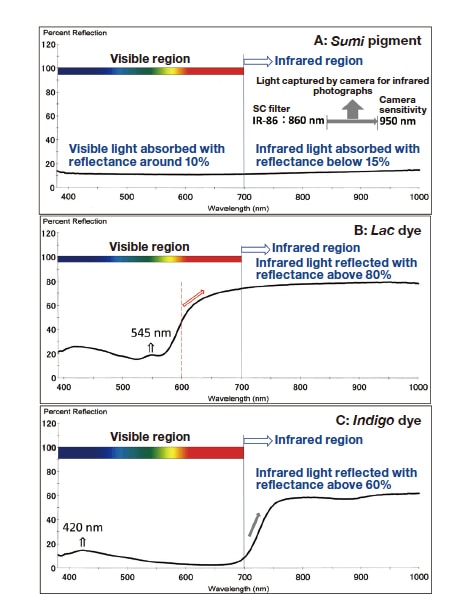
Fig. 11 Visible/near-infrared reflection spectra for sumi ink (A), lac (B), and indigo (C).
The ukiyo-e woodblock prints produced during Japan's Edo period used a variety of substances to achieve blue coloration. Commelinin was the blue pigment of choice throughout the Meiwa and Kansei periods (1765-1800), but the years between the late Kansei period and the end of the Bunka period (1817) witnessed the discovery of indigo, which became increasingly popular after the start of the Bunsei period in 1818 and was the most common choice by the mid-Bunsei era, around the year 1824. The transition from indigo to Prussian blue began in 1830, the first year of the Tenpo era, and proceeded rapidly: by Tenpo 2 (1831) Prussian blue was used in fully 86% of all ukiyo-e prints, and by Tenpo 3 (1832) the figure was nearly 100%6,7). To investigate this historical evolution in the blue colorants of ukiyo-e prints, we analyzed a large set of ukiyo-e specimens, focusing in particular on shibai-e and yakusha-e prints*3 made to promote kabuki dramas and actors. Where necessary, we combined visible/near-infrared reflection spectra with other types of analyses discussed below—including XRF spectra to assist in identifying Prussian blue and 3DF spectra to assist in identifying indigo—but in many cases we found that visible/near-infrared reflection spectra—which are quick and easy to measure in our non-destructive setup—alone sufficed to distinguish commelinin, indigo, and Prussian blue. This is illustrated by the visible/near-infrared reflection spectrum of commelinin shown in Figure 12, which we readily observe to differ sufficiently from both the Prussian blue spectrum in Figure 10A and the indigo spectrum in Figure 11C to allow rapid identification of the blue colorant used in a given ukiyo-e specimen from the shape of measured reflection spectra.
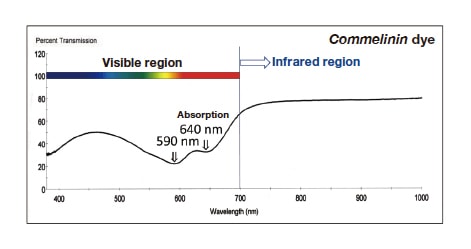
Fig. 12 Visible/near-infrared reflection spectrum of commelinin.
In addition to the insights described above, our use of visible/near-infrared reflection spectra as a tool for nondestructive analysis also achieves an interesting feat of historical detective work: We have established that Katsushika Hokusai's famous woodblock-print series "Thirty-Six Views of Mount Fuji," published around the first year of the Tenpo era, marks the first appearance of landscape images as a particular subgenre of ukiyo-e prints. As shown in Figure 13, each of the 36 prints in this series, labeled "Front views of Mount Fuji", makes use of both dark and light shades of blue to depict the sky and the sea in ways that lend the viewer a sense of closeness—or of distance. This is achieved via the method of bokashi printing8), and by measuring visible/near-infrared reflection spectra for the sky and sea regions of each of the 36 prints we have confirmed that the spectrum of Prussian blue (KFe[Fe(CN)6]3・nH2O), shown in Figure 10A, is present in all cases, while XRF spectral measurements, discussed below, confirm the presence of iron Fe5). The attractive bokashi appearance evoked by this genre of landscape images is impossible to achieve without the ultraminiature particles and bright blue coloration of Prussian blue, and thus we may say that the use of Prussian blue was a key enabling factor allowing the genre of landscape images to be introduced into the world of ukiyo-e woodblocks.
In the production process for ukiyo-e prints, the first step was to use a printing block known as a "key-block" (omohan9)) to print the title of the work and the signature of the illustrator, as well as pictures consisting of line drawings, and a sequence of "color-blocks" (irohan)—sculpted separately for each color in the image—was applied, each superposed on top of the last, to yield multicolored prints. In typical ukiyo-e processes, the omohan was used with sumi ink, but the "Thirty-Six Views" deviated from this pattern by using an omohan with blue indigo. Consequently, our measurements of visible/near-infrared reflection spectra for the title and signature regions and the outlines in the Thirty-Six Views series exhibit the characteristic shape of the indigo spectrum (Figure 11C)6).
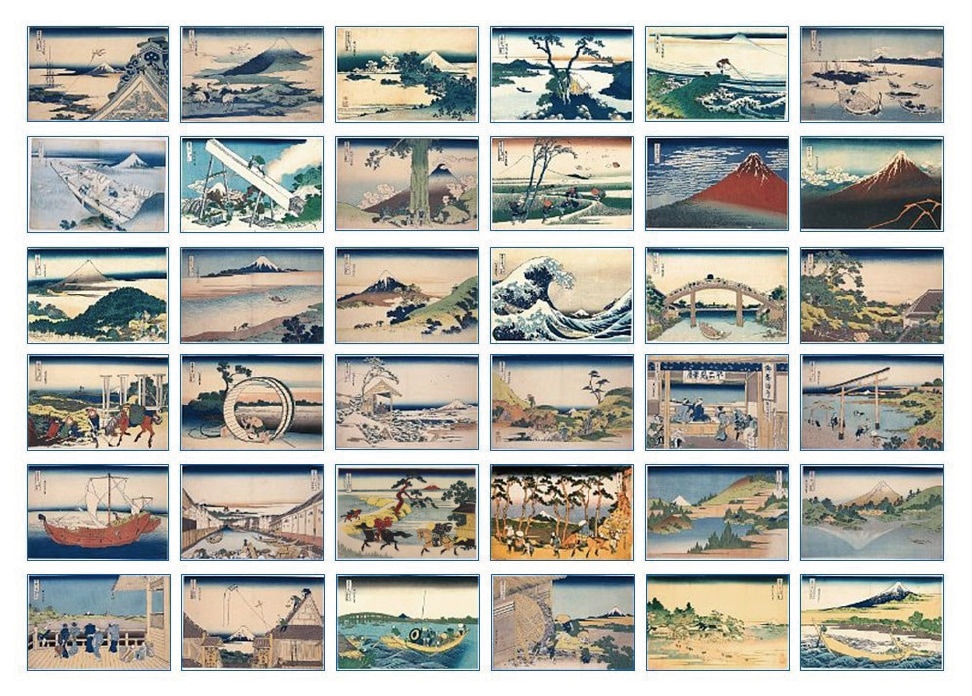
Fig. 13 Katsushika Hokusai's "Thirty-Six Views of Mount Fuji (Front Views of Mount Fuji)".
In regions of specimens containing pigments with high infrared transmittance, line-drawing sketches and other features that lie beneath surface layers are easily detected in infrared photographs1). To this end, the reflectance values plotted in the visible/near-infrared reflection spectrum of a colorant may simply be reinterpreted in terms of transmittance values*4. This observation allows us to understand how a colorant appears in infrared photographs—specifically, the extent to which the colorant produces white regions or black regions in infrared photographs—based on reflectance data measured for the colorant in the near-infrared region. For example, if the reflectance of a colorant exceeds 60% in the infrared region, we may infer that the colorant will also exhibit high transmittance above 60%; consequently, most infrared radiation will pass through the colorant into the specimen, reflect from fiber surfaces or other features lying deeper within the specimen, then pass through the colorant a second time as it travels back out of the specimen to be captured by the camera, producing white regions in infrared photographs. In contrast, a colorant whose infrared reflectance is below 20% will also exhibit low transmittance below 20%; when capturing infrared photographs, such colorants will absorb most of the incident infrared light before it can travel deeper into the specimen and be reflected from fiber surfaces, and the absence of reflected light captured by the camera will produce black regions in infrared photographs. For intermediate colorants with near-infrared reflectance values around 40%, incident infrared radiation will be partially absorbed and partially transmitted; the transmitted portion will be reflected from fiber surfaces or other features beneath the colorants and will travel back out of the material—passing through the colorant a second time—to be captured by the camera, but the relatively low intensity of this reflected light will produce grey regions in infrared photographs.
Applying these observations to the colorants considered above, vermilion (Figure 9A), lac (Figure 11B), and indigo (Figure 11C) all exhibit a near-infrared reflectance of more than 60%, and thus appear as white regions in infrared photographs. In contrast, malachite (Figure 9C), Prussian blue (Figure 10A), azurite (Figure 10B), and sumi ink (Figure 11A) all exhibit a near-infrared reflectance of less than 20%, and thus appear as black regions in infrared photographs. Finally, the iron-oxide-based pigments Bengala and yellow ochre (Figure 9B), together with smalt (Figure 10C), have near-infrared reflectance values around 40%, and thus appear as grey regions in infrared photographs. This indicates how correlations between these two types of data—infrared photographs and visible/near-infrared reflection spectra—may be used to check the accuracy of analytical results.
One of the dyes commonly used in bingata garments is the red colorant lac (laccaic acid). Figure 14 shows visible/near-infrared reflection spectra measured for red flower-petal regions in an iris pattern on a bingata specimen. In this spectrum we see a characteristic peak near 545 nm in the visible region, indicating a slight increase in reflectance, with the reflectance rising for wavelengths longer than 600 nm and remaining high into the near-infrared region. Note that the characteristic reflection peak near 545 nm matches the measured spectrum for lac shown in Figure 11B. However, the difference between the maximum and minimum measured reflectance values in Figure 14 is smaller than the corresponding gap in Figure 11B, suggesting that the colors for the specimen in Figure 14 are less intense (less brilliant) than those in the standard specimen*5 whose principal ingredient was lac and whose spectrum is shown in Figure 11B. The reason of this discrepancy is explained below in our discussion of XRF spectral measurements.
The visible/near-infrared reflection spectra that we measured for the red flower petals in the iris pattern also revealed the presence of lead (Pb), indicating that white lead (2PbCO3・Pb(OH)2) was used as a white colorant together with lac as a red colorant. Blending with white lead has the effect of increasing the brightness of the lac —that is, making it appear whiter—while decreasing the color intensity (brilliance), thus reducing the gap between the maximum and minimum reflectance values in Figure 14. Nonetheless, the appearance in the measured reflection spectra of a weak peak near 545 nm clearly indicates that the substance in question is in fact lac. As discussed below, the fluorescence fingerprint for lac obtained from 3DF spectra confirm that that red flower-petal regions of the iris pattern contain a blend of white lead and lac that has the effect of modifying the observed shade of red.
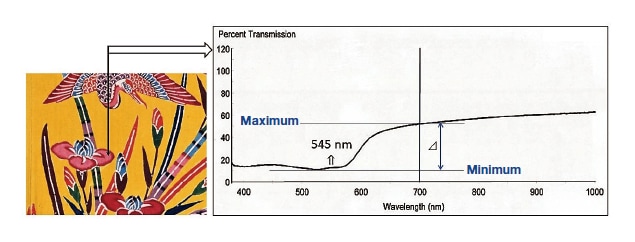
Fig. 14 Visible/near-infrared reflection spectrum measured for red region of bingata specimen.
Figure 15 shows the setup we use for on-site measurement of XRF spectra. This apparatus does not use a fluorescent X-ray tube as an X-ray source; instead, X-rays are generated by an X-ray-emitting radioactive isotope. More specifically, the X-ray source (made by AET Technologies) consists of pellets of 241Am arranged in a ring and hermetically sealed in a ceramic container, yielding a fully enclosed annular source of X-rays with an activity of 1.85 MBq. To measure XRF spectra, as shown in Figure 15, we position this source (labeled A in the figure) at a distance of approximately 5 mm from a preselected measurement point on a specimen, thus irradiating the specimen with X-rays emitted by 241Am. (These X-rays have energies of 13.95 keV, 17.74 keV, and 59.54 keV.) The source produces a circumferential pattern of X-ray irradiation that induces XRF from elements present within a 12-mm-diameter circular region of the specimen centered on the measurement point. The energies of these fluorescent X-rays are measured by a semiconductor detector (Amptek XR-100CR Si-PIN, Be window 0.3 mil=7.62 μm, energy resolution 180-205 eV, labeled C in Figure 15). The signal from this detector is amplified by a preamp (Amptek PX2T/CR-type, labeled D), separated by a miniature multichannel pulse-height analyzer (Amptek PMCA-8000A, labeled E), and converted into XRF spectral data by a software package installed on a PC (F). Because this is an energy-dispersive apparatus, it is capable of simultaneous multi-element analysis. Shielding material (lead, labeled B) enclosing the upper surface, the perimeter, and the inner cavity region of the X-ray source (A) prevents X-rays emitted by the source from entering the window of the detector (C). The tip of the detector is affixed to the upper surface of the source across the shielding material.
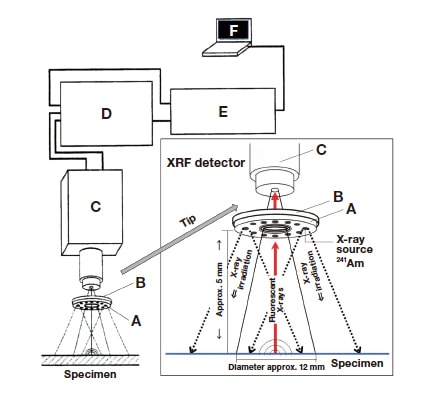
Fig. 15 Setup for X-ray fluorescence measurements.
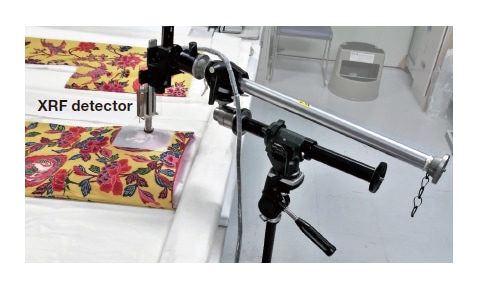
Fig. 16 Measuring XRF spectra for bingata specimen.
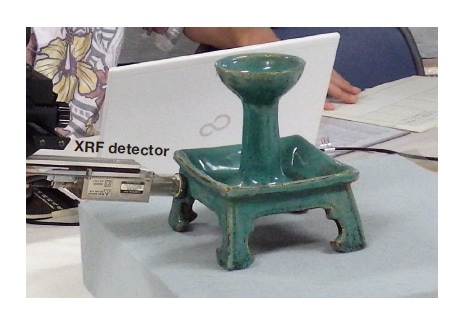
Fig. 17 Measuring X-ray fluorescence spectra for cultural property deemed a Japanese national treasure: square-base candle stand with green Ryoku-Yu glaze.
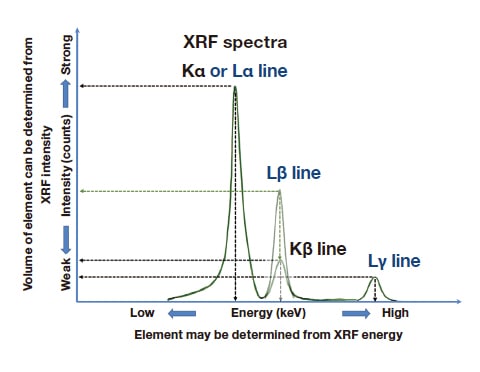
Fig. 18 Conceptual diagram illustrating typical X-ray fluorescence spectra.
To measure XRF spectra of bingata specimens using this apparatus, we begin by mounting the X-ray source A / detector C assembly on an adjustable arm designed for use as a stationary camera mount (Figure 16). We use the arm to position the source/detector assembly above the bingata specimen at a distance of approximately 5 mm from the preselected measurement point; the assembly will remain in this position throughout the non-contact measurement. The specimen is then irradiated by X-rays emitted from the 241Am source, inducing elements in the vicinity of the preselected measurement point to emit fluorescent X-rays, whose energies are measured by the detector C.
Similarly, to measure XRF spectra for a piece of pottery or similar specimen, we fix the position of the source/detector assembly at a distance of approximately 5 mm from a flat portion of the pecimen, as shown in Figure 17; again, X-rays emitted by the 241Am source irradiate the specimen and induce the emission of fluorescent X-rays whose energies are measured by the detector. As the X-ray irradiation time increases, the measured XRF spectra increasingly come to resemble the spectrum shown in the conceptual diagram in Figure 18. The length of time required to obtain accurate spectra for a given element depends on how much of the element is present in the specimen. The larger the volume of the element contained in the specimen, the more rapidly the measured spectral curve will take shape*6, and thus the shorter the measurement time required to yield clear spectra. Typical measurement times [characterized by Live Time (LT), the time required to accumulate an effective number of X-ray counts] depend on the volume of the given element contained in the specimen, but are on the order of 180-600 s (3-10 min) if the element in question is abundant in the specimen, or 1200-1800 s (20-30 min) if the element is scarce in the specimen. For specimens containing particularly low volumes of a given element, the time required to measure clear XRF spectra may exceed 3600 s (1 h). These long measurement times are a consequence of the weak X-ray source in our apparatus: the 241Am source has an activity of just 1.85 MBq. However, this source was purchased through the Japan Radioisotope Association, with certification from AET Technologies USA, in 1999, prior to the 2005 enactment of the "Act on the Regulation of Radioisotopes, etc." that is currently in effect in Japan. Because the activity of the source does not exceed the limit (3.7 MBq) set by the previous regulatory framework, at present the source can be used with no need to notify, or receive permission from, relevant oversight bodies—assuming, of course, that it is used and managed properly. Moreover, because the source is hermetically sealed and has an intensity below 3.7 MBq, there is no need to worry about exceeding the regulated maximum dose of external radioactivity (1.3 mSv over 3 months); consequently, we can use the source for nondestructive on-site analyses at museums and other facilities without needing to establish controlled X-ray areas. Also, although the activity of this source was 1.85 MBq in the year it was constructed (1998), this activity has decreased over the ensuing 25 years. Specifically, based on the 432-year half-life of 241Am, we calculate that the activity of the source has declined by 5.8% since its construction, placing its current activity at 1.74 MBq. We consider this to be more than adequate for use in X-ray fluorescence analysis. However, if we ever purchase a new X-ray source, we will need to receive permission to use it in accordance with current laws and regulations.
As shown in the conceptual diagram in Figure 18, XRF spectra are obtained by plotting the intensity (counts) on the vertical axis against the energy (keV) on the horizontal axis. These curves describe the energy and intensity of fluorescent X-rays emitted by the constituent elements of the specimen. The XRF energy is indicated by the horizontalaxis position of peaks in the spectrum, while the intensity is indicated by the peak height.
The X-rays emitted by the 241Am source, which have energies of 13.95 keV, 17.74 keV, and 59.54 keV, induce different types of fluorescent X-ray emissions from different elements. Elements in column 4 of the periodic table—including calcium (Ca), titanium (Ti), chromium (Cr), manganese (Mn), iron (Fe), cobalt (Co), nickel (Ni), copper (Cu), zinc (Zn), and arsenic (As)—emit fluorescent X-rays with the characteristic energy of the Kα line. For column-5 elements such as silver (Ag), cadmium (Cd), and tin (Sn), fluorescent X-ray emissions have the characteristic energy of the Kβ line. Meanwhile, column-6 elements—such as barium (Ba), tungsten (W), platinum (Pt), gold (Au), mercury (Hg), and lead (Pb)—emit fluorescent X-rays with the energies of the Lα line, the Lβ line, and the Lγ line. Consequently, fluorescent X-ray emissions from a single element may be organized into groups: the Kα-line and Kβ-line spectra in Figure 18 form a doublet, while the Lα-line, Lβ-line, and Lγ-line spectra form a triplet. The energies of fluorescent X-ray emissions from a given element are characteristic of that element, and reference manuals for X-ray analysis contain detailed tables listing characteristic Kα-line and Kβ-line energies, or characteristic Lα-line, Lβ-line, and Lγ-line energies, for the various elements of the periodic table, ordered by atomic number11). Using these tables, measured XRF spectra can be compared to tabulated data: if the horizontal-axis position of a peak in a measured spectrum matches the characteristic fluorescent X-ray energy tabulated for a given element, it can be concluded that this element is present in the sample. Table 2 lists the energies of various fluorescent X-ray emissions from the constituent elements of common pigments and metals. If the measured energy of a fluorescent X-ray emission from a specimen (that is, the energy read off from the horizontal-axis position in the XRF spectrum) matches the energy tabulated for a given element, the pigments or metals having that element as a constituent can be identified.
Also, for a specimen irradiated by X-rays of a given intensity, the intensity of fluorescent X-ray emissions from an element is proportional to the volume (number of atoms) of that element contained in the specimen. We can make use of this observation as follows: We prepare standard specimens containing different known concentrations of a particular element, measure the XRF intensity for each of these specimens, then plot the intensity for each specimen versus the concentration of the given element in that specimen. The resulting plot, known as a calibration curve, can then be used to quantify the concentration (volume) of the given element in an unknown specimen based on the XRF intensity for that specimen.
Table 2 Energies of fluorescent X-rays emitted by constituent elements of pigments and metals
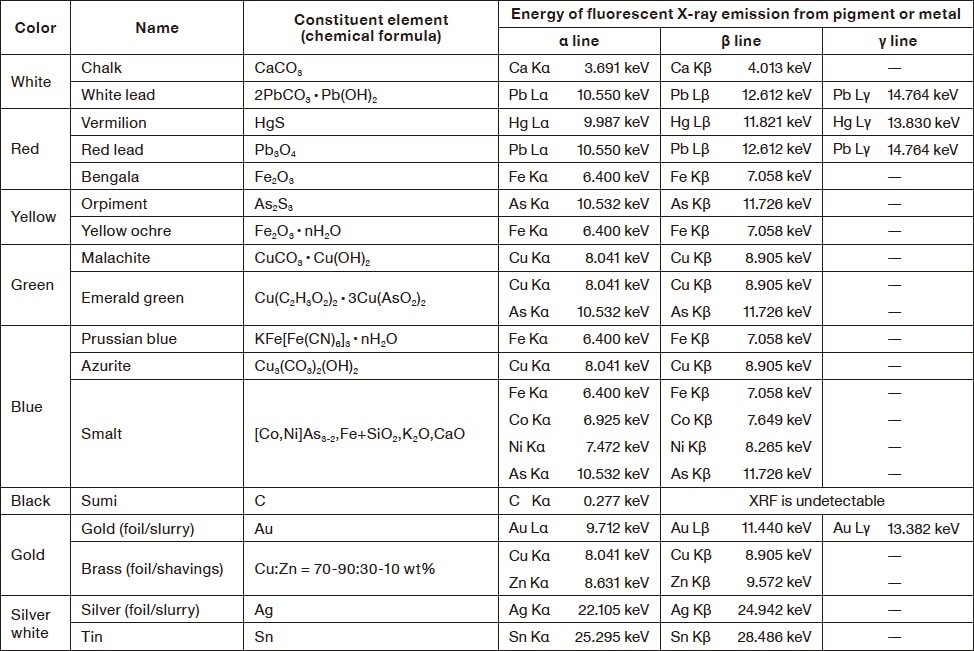
(Intensity ratio) Kα/Kβ: approximately 10:1; Lα/Lβ: between 10:6 and 10:5; Lβ/Lγ: approximately 10:1
Kα-line and Kβ-line emissions, which form a doublet, differ in intensity by roughly a factor of 10, i.e., the intensity ratio is approximately Kα:Kβ = 10:1. For Lα-line and Lβ-line emissions, which are part of a triplet, the intensity ratio is typically adjusted by varying the voltage of the X-ray tube used to generate X-rays to a value somewhere between Lα:Lβ = 10:10 and Lα:Lβ = 10:512). However, this procedure is not available in our apparatus, which uses a 241Am source (activity 1.85 MBq) in place of an X-ray tube. Consequently, while the Kα-line/Kβ-line intensity ratio in our experiments assumes its usual value of roughly 10:1, the Lα-line/Lβ-line intensity ratio is roughly 10:6 or 10:5. Also, if Lα-line and Lβ-line emissions are observed, then Lγ-line emissions are also observed, although with low intensity: the Lβ-line/Lγ-line intensity ratio is roughly 10:1.
As an example, Figures 19a and 19b show XRF spectra measured by our apparatus for the green pigment emerald green (Cu(C2H3O2)2・3Cu(AsO2)2) and for the white pigment white lead (2PbCO3・Pb(OH)2). Because our apparatus is an energy-dispersive fluorescent X-ray analyzer based on a semiconductor detector, it can simultaneously detect fluorescent X-ray emissions from multiple elements. Emerald green contains Cu and As as constituent elements, and both elements emit fluorescent X-rays, whose energies we detect. As shown in Figure 19a, from Cu we obtain spectrum A, corresponding to the 8.04 keV Cu-Kα line, and spectrum B, corresponding to the 8.92 keV Cu-Kβ line. For As we obtain spectrum C, corresponding to the 10.54 keV As-Kα line, and spectrum D, corresponding to the 11.75 keV As-Kβ line. In both cases, the Kα-line/Kβ-line intensity ratios are approximately 10:1. On the other hand, white lead contains Pb as a constituent element; as shown in Figure 19b, we obtain spectrum A, corresponding to the 10.55 keV Pb-Lα line, spectrum B, corresponding to the 12.64 keV Pb-Lβ line, and spectrum C, corresponding to the 14.76 keV Pb-Lγ line. The Lα-line/Lβ-line intensity ratio is roughly 10:6 or 10:5, while the Lβ-line/Lγ-line intensity ratio is roughly 10:1.
From the above discussion, the intensity ratio for Kα-line and Kβ-line emissions, which form a doublet, differs from that for Lα-line and Lβ-line emissions, which form a triplet. This observation may be used to determine whether peaks in measured spectra correspond to Kα-line and Kβ-line emissions or to Lα-line and Lβ-line emissions*7. Note that, in XRF spectra, Kβ-line energies are higher than Kα-line energies, so that the horizontal-axis positions of Kβ-line peaks lie to the right of the positions of Kα-line peaks. Similarly, Lβ-line energies are higher than Lα-line energies (so Lβ-line peaks lie to the right of Lα-line peaks) and Lγ-line energies are higher than Lβ-line energies (so Lγ-line peaks lie to the right of Lβ-line peaks). This observation is useful for, e.g., deciphering whether features appearing in measured XRF spectra are attributed to Kα and Kβ lines for a given element or to Lα and Lβ lines for that element.
Our apparatus is an energy-dispersive X-ray fluorescence analyzer based on a semiconductor detector with an energy resolution of 180-205 eV; this means it is capable of simultaneously detecting the energies of fluorescent X-ray emissions from multiple elements. However, if the energies of X-rays emitted from distinct elements are nearly equal—specifically, if they differ by less than our detector resolution of 205 eV = 0.205 keV—then the two spectra overlap in our setup. For example, as noted above, the green pigment emerald green includes both Cu and As among its primary constituent elements, and thus fluorescent X-rays emitted simultaneously from both of these elements appear in measured XRF spectra. If emerald green was the only colorant used in a specimen, then, as shown in Figure 19a, the Kα-line and Kβ-line emissions from Cu and As are not close in energy, so there would be no overlap and we would have no difficulty measuring both spectra simultaneously. However, in practice emerald green is used together with other colorants; for example, the white pigment white lead is sometimes added to increase brightness and yield a brighter hue. For a specimen in which the white pigment white lead is combined with dark-green emerald green to yield a brighter shade of green, XRF measurements simultaneously detect the energies of X-ray emissions from emerald green (Figure 19a) and from white lead (Figure 19b), yielding the spectrum shown in Figure 19c, in which the As-Kα line emission from emerald green overlaps with the Pb-Lα line emission from white lead. Note that this phenomenon is not limited to the specific case of emerald green mixed with white lead, but would arise for any specimen in which As and Pb are simultaneously present, due to the similar energies of the As-Kα line (10.532 keV) and the Pb-Lα line (10.550 keV).
Similarly, the yellow pigment orpiment (As2S3) is sometimes combined with the red pigment vermilion (HgS) to yield orange coloration. When these two colorants are simultaneously present, we have Kα-line (10.532 keV) and Kβ-line (11.726 keV) emissions from As, a primary constituent of orpiment, together with Lα-line (9.987 keV) and Lβ-line (11.821 keV) emissions from Hg, a primary constituent of vermilion; this results in an overlap between the As-Kβ line (11.726 keV) and the Hg-Lβ line (11.821 keV). The same difficulty would arise even if orpiment and vermilion were present in separate but neighboring regions of a specimen.
As an example, consider the bingata garment pattern shown in Figure 20. For this specimen, XRF spectra measured in yellow regions of the garment contained three spectral peaks: peak A, near 9.98 keV; peak B, near 10.54 keV; and peak C, near 11.73 keV. A first observation is that the intensities for peaks B and C differ by a factor of approximately 10, i.e., the B:C intensity ratio is 10:1. This suggests that the higher-intensity peak B is a Kα-line peak, while the lower-intensity peak C is a Kβ-line peak forming a doublet with peak B. Next, referring to Table 2, we ask: What pigment would emit both a Kα line corresponding to an energy of 10.54 keV and a Kβ line corresponding to an energy of 11.73 keV? As the measured specimen region is primarily yellow in color, we deduce that peak B corresponds to the Kα line (10.532 keV) for As—a principal constituent of orpiment—while peak C corresponds to the Kβ line (11.726 keV) for As. Based on these findings, we conclude that the yellow pigment here is orpiment.
The only remaining mystery is the origin of peak A at 9.98 keV. Again referring to Table 2, we ask: Which element emits fluorescent X-rays corresponding to this energy? A quick search reveals the answer: Hg, whose Lα line energy is 9.987 keV, and whose Lβ line—which forms a doublet with the Lα line—lies at 11.821 keV, and thus overlaps in our measured spectrum with peak C, i.e., with the As-Kβ line at 11.726 keV.
As this example demonstrates, a thorough understanding of the phenomenon of overlapping spectra is essential for correctly interpreting spectral measurements—and for deciphering the mystery of "Where did this peak come from?!"
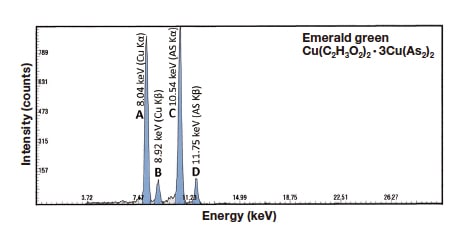
Fig. 19a XRF spectrum of emerald green.
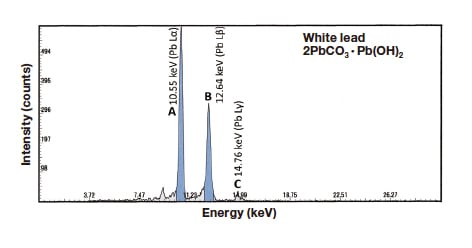
Fig. 19b XRF spectrum of white lead.
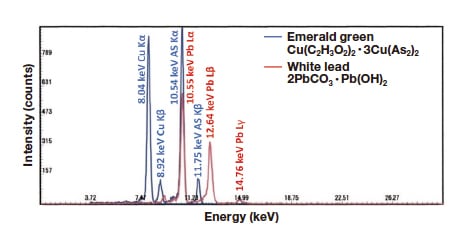
Fig. 19c Measured XRF spectrum for a specimen containing both emerald green and white lead, illustrating overlapping spectral features.
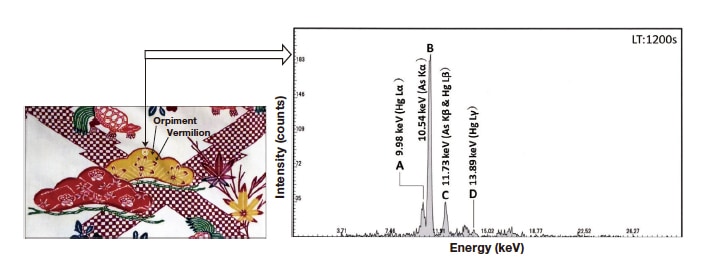
Fig. 20 XRF spectrum (right) measured for the yellow-colored region of the specimen shown on the left, which contains the yellow pigment orpiment and lies adjacent to a red-colored specimen region containing the red pigment vermilion.
In some cases, an understanding of the historical trajectory that led to the introduction of a new pigment can serve to facilitate the challenge of simultaneously analyzing multiple constituent elements in specimens. As one example, Figure 21 shows a cultural-property specimen for which our measured XRF spectrum successfully identified the presence of the classical blue pigment smalt. The specimen in this case is an artwork entitled Images of Rashomon (dimensions: 134.4 cm tall × 102.3 cm wide) that was painted on a wooden prayer board and left as an offering to the Asakura Shrine in Fukui Prefecture in Japan in the second year of the Tenna era (1682). The painting depicts the samurai warrior Watanabe no Tsuna, and we measured XRF spectra for a blue region painted on the dome of the warrior's helmet.
Smalt, the oldest man-made Co-based pigment, is made by adding Co ore ([Co,Ni]As3-2,Fe) to molten silicate glass (SiO2,K2O,CaO) to yield a blue-colored glass, which is then ground into a powder13,14). The Co content of the ore is the source of the blue coloration, but the ore also contains Fe, Ni, and As. Armed with this knowledge, we can determine the origins of various elements whose presence is indicated by the XRF spectrum in Figure 21. Ca originates from silicate glass, while Fe, Co, Ni, and As originate from Co ore. Although there is a paint named smalt that is commercially available today, it is made with Co as the sole source of blue coloration and is distinct from the classical pigment known as smalt. The spectral features marked “scatter” in Figure 21 are due to X-rays emitted from the 241Am source (with energies of 13.95 keV and 17.74 keV) that undergo scattering processes and are erroneously captured by the detector; they represent an instrumental artifact and do not indicate peaks associated with elements present in the sample.
Analyzing XRF spectra is a technique that works well for inorganic substances such as pigments and metals, but cannot be used for organic substances such as dyes. The reason for this is that the fluorescent X-rays emitted from C, a component of sumi ink, have extremely low energies—just 0.277 keV—and cannot be detected by any X-ray fluorescence analyzer currently available. This also means that XRF analysis cannot be used to study dyes or other organic substances structured primarily around C bonds.
![Fig. 21 Left: Images of Rashomon, an artwork presented as an offering to a shrine in Japan's Edo period [Tenna 2 (1682)]. Right: XRF spectrum measured for a bluepigment-filled subregion of the dome of the warrior's helmet.](/image/global/sinews/si_report/130216/index_26.jpg)
Fig. 21 Left: Images of Rashomon, an artwork presented as an offering to a shrine in Japan's Edo period [Tenna 2 (1682)]. Right: XRF spectrum measured for a bluepigment-filled subregion of the dome of the warrior's helmet.
Tsuikin is a method for transferring pictorial patterns onto lacquerware. In this technique, a pigment is uniformly blended with lacquer to yield a paste known as tsuikin-mochi, which is stretched into a thin sheet, cut into shapes appropriate for the pattern, and affixed to lacquerware items. The cultural property shown in the lower left panel of Figure 22—a tray made from black-lacquered wood that is recognized as a Japanese national treasure—was decorated by tsuikin. The other panels in Figure 22 show the results of various non-destructive analyses of this specimen: an XRF spectrum measured for a yellow-colored region of the tsuikin decoration (upper left), an XRF spectrum measured for a green-colored tsuikin region (upper right), and a visible/near-infrared reflection spectrum measured for the same greencolored tsuikin region (lower right).
Looking first at the XRF spectrum for the yellow tsuikin region (upper left), we see two peaks—peaks A and B—at energies of 10.54 keV and 11.77 keV, respectively, with the intensity of peak A being approximately ten times greater than that of peak B (intensity ratio A:B = 10:1). This suggests that peaks A and B respectively indicate Kα and Kβ lines for some element. Consulting Table 2, we find that this element is As, whose Kα and Kβ lines have energies of 10.532 keV and 11.726 keV, respectively. Hence we conclude that orpiment (As2S3) was used to produce the yellow color of this specimen region. In other words, the yellow-colored pictorial pattern on the tray was produced by blending orpiment uniformly with lacquer to yield a tsuikin-mochi paste.
Looking next at the XRF spectrum for the green tsuikin region (upper right), we see two peaks (peaks B and C) with intensities differing by roughly a factor of ten (intensity ratio B:C = 10:1), again suggesting Kα and Kβ lines for some element. Matching the positions of the peaks to data in Table 2, we conclude that peaks B and C are the Kα and Kβ lines for the yellow pigment orpiment, respectively. This spectrum also exhibits a peak (peak A) at 6.39 keV, which we identify as the Fe-Kα line (energy: 6.400 keV). We attribute the presence of Fe in this region to the black lacquer16) used to coat the tray, which was prepared by adding Fe powder or pellets to liquid lacquer; the Fe-Kα line seen here is not due to Fe present in the yellow tsuikin region. This interpretation is also supported by the fact that the Fe-Kα and Fe-Kβ lines both appear prominently in the XRF spectrum measured for a region of the specimen containing only black lacquer, with no tsuikin colorations.
Thus, we now face this question: Which blue colorant was used in combination with yellow-colored orpiment to yield the green coloration? It has been suggested that malachite may have been used in some cases to yield green lacquer16). However, we see here neither the Cu-Kα (8.041 keV) or Cu-Kβ (8.905 keV) lines that we would expect to find for coppercontaining malachite (CuCO3・Cu(OH)2). According to Ref. 16, "Looking at historical records from long-past eras, we find statements indicating that the indigo used was the same indigo used to make indigo dye". But Ref. 17 says that "although indigo existed at that time, it is unclear whether or not it was used in mixtures with orpiment." To clarify this murky situation, we switch to a different method of analysis: we measure visible/near-infrared reflection spectra for the same green tsuikin region, yielding the reflection spectrum shown at the lower right in Figure 22. Because this spectrum is measured for a green-colored region, it exhibits no peaks in the 400-500 nm wavelength interval corresponding to blue and violet. On the other hand, the shape of the spectral curve—with the reflectance increasing in the near-infrared region beyond 700 nm—resembles the spectrum of indigo in Figure 11C. The indigo in indigo dye, when stored in the clay or ceramic jars commonly used as storage containers, tends to produce water-soluble leuco salts (green-colored), which are oxidized in air to yield a non-soluble crystalline blue substance used as a pigment18). Based on these findings, we conclude that green tsuikin regions are produced by blending the yellow colorant orpiment with the blue colorant indigo to yield a green colorant.
A cultural property that does not involve tsuikin but is nonetheless relevant here is a Gold-inlaid green-lacquered wood tray held by the Okinawa Churashima Foundation. A green colorant has been applied to the four corners of this tray, and the XRF spectra and visible/near-infrared reflection spectra measured for these green regions are similar to those in Figure 22. Thus we conclude that, for this specimen as well, orpiment was blended with indigo to yield a green lacquer that was applied to the specimen19).
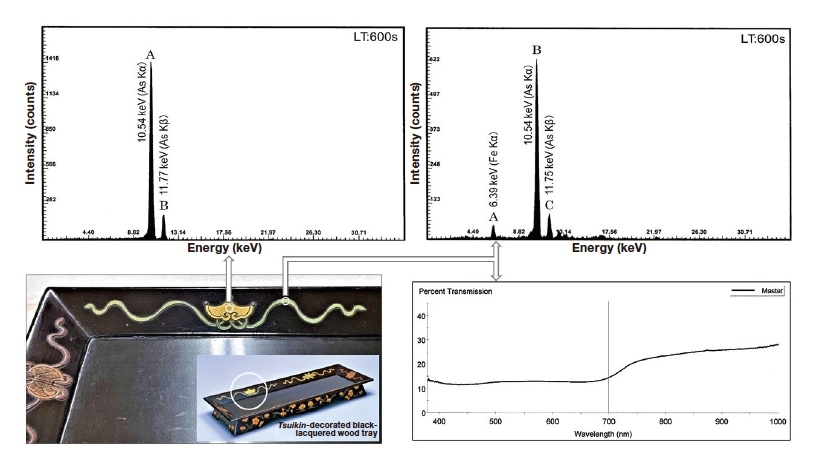
Fig. 22 Lower left: A tray recognized as a Japanese national treasure made from black-lacquered wood and decorated by tsuikin,. Upper left: XRF spectrum measured for a yellow region of the tsuikin decoration. Upper right: XRF spectrum measured for a green region of the tsuikin decoration. Lower right: Visible/near-infrared reflection spectrum measured for the same green region of the tsuikin decoration.
The Japanese national treasure in Figure 17, a square-base candle stand with green Ryoku-Yu glaze, is one example of Ryoku-Yu glazed pottery. According to Ref. 21, Ryoku-Yu glaze—also known as Ao-Oribe-Yu ("green glaze")—is prepared by "adding copper oxide (Cu2O) to transparent wood-ash glaze or lime glaze, then firing; in some cases, impurities such as chalcanthite (copper sulfate CuSO4・5H2O), shavings of brass [an alloy of copper (Cu) and zinc (Zn)], or shavings of copper may be added to the copper component to add color". Figure 23 shows the XRF spectrum measured for the skin layer of the Ryoku-Yu glazed candle stand. We identify six peaks in this spectrum: peak A (3.69 keV), peak B (6.41 keV), peak C (8.00 keV), peak D (8.67 keV), peak E (8.88 keV), and peak F (9.54 keV). The highestintensity peak is peak C, which corresponds to the Cu-Kα line (8.041 keV) and reflects the presence of Cu as the principal colorant in the fired glaze. Peak E corresponds to the Cu-Kβ line (8.905 keV). The next highest-intensity peak is peak D, at an energy of 8.67 keV, which is roughly ten times more intense than peak F (9.54 keV) (intensity ratio D:F = 10:1). This suggests that peaks D and F correspond to the Zn-Kα (8.631 keV) and Zn-Kβ (9.572 keV) lines. Thus we conclude that Cu and Zn coexist in the portions of this green glaze that add coloring upon firing, and that the glaze consists of brass shavings. Finally, peaks A (3.69 keV) and B (6.41 keV) correspond to the Ca-Kα line (3.691 keV) and the Fe-Kα line (6.400 keV); Ca and Fe are present in the clay materials and lime-ash glazes (calcium carbonate CaCO3) used as raw materials.
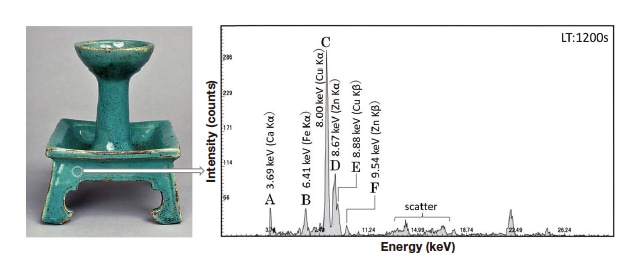
Fig. 23 XRF spectrum measured for the Ryoku-Yu glaze used in the Japanese national treasure in Figure 17.
At present, we use two similar analytical instruments to measure 3DF spectra: For on-site analyses at museums or other remote locations, we use a Hitachi F-2500 fluorescence spectrophotometer (weight: 35 kg) equipped with an optical fiber, while for analyses in our home laboratory we use a Hitachi F-7000 fluorescence spectrophotometer (weight: 41 kg) permanently installed in a fixed location and similarly equipped with an optical fiber. In some cases, the cultural property we wish to analyze cannot be moved, and in some cases we must analyze not only the cultural property but also various aspects of the environment in which it is housed, such as the vessels in which it is stored. In such cases, we transport our F-2500 system to the remote site—either by hiring a shipping company capable of handling delicate instruments, or by hand-delivering the system ourselves in a private vehicle. In the latter case the spectrophotometer and the optical fiber are packaged in a custom-designed protective metal carrying case. Needless to say, among the accessory items transported with the system for use at remote sites are samples of rhodamine B and other reagents, as well as secondary standard light sources, to facilitate the steps required to prepare the instrument for use at the remote site, including measuring instrument response functions (and applying spectral corrections) and measuring instrument properties in the long-wavelength fluorescence region. Figure 24 shows a simplified schematic diagram of the optical fibers we use for the F-2500 and F-7000; thick lines in this diagram represent the shapes of fibers. Initially, we adopted a fiber configuration in which the excitation side used 48 fiber cores bundled into a single cable, while the fluorescence side used 32 fiber cores arranged in a double-bundle configuration designed to wrap around the perimeter of the excitation cable. However, we now use a different configuration in which both the excitation-side fibers (total of 48 cores) and the fluorescence-side fibers (total of 48 cores) are dispersed and randomly bundled. To evaluate the performance of these two fiber configurations, we measured 3DF spectra (as shown in the center of Figure 26) under identical measurement conditions and compared the two fluorescent intensity values; the results demonstrated that the measured intensity was approximately 2.5 times greater for the random-bundle configuration than for the doublebundle configuration—even with an L39 filter installed on the fluorescence side to eliminate secondary light producing scattering artifacts in 3DF spectra—thereby allowing the detector to capture more of the fluorescent light emitted by measurement specimens22). However, with the tip of the optical fiber positioned at a distance of approximately 5 mm from the specimen, the spot size—that is, the diameter of the region irradiated by the fiber—is approximately 3 mm for the double-bundled configuration, but expands to approximately 5 mm for the random configuration.
To measure 3DF spectra at remote sites using the F-2500 with this randomly-bundled optical fiber, we use a setup like that shown in Figure 25. We begin by covering the measurement sample (a bingata garment in the case of Figure 25) with a protective sheet from which we have cut out a circular hole approximately 30 mm in diameter. The sheet is positioned such that the center of this hole lies at a preselected measurement point on the specimen. Then we place the light-blocking box, into which the tip of the optical fiber is inserted, on top of the protective sheet (the mass of the box is 390 g), open its view portal, and look through this portal while adjusting the positioning to ensure that the tip of the optical fiber lies above the measurement point at a distance of approximately 5 mm from the specimen surface. Upon completing this preparation we begin the measurement. When adjusting the position of the light-blocking box after inserting the optical-fiber tip, it is desirable to pass visible light (e.g., 550 nm) through the fiber.
When we first began to pursue the research program described in this article, our analytical instrument was a Hitachi F-4010 fluorescence spectrophotometer. Natural dyes derived from animal or plant matter, whose molecular structure involves a significant prevalence of covalent double bonds23), exhibit characteristic excitation and fluorescence wavelengths, and thus it should be possible to use fluorescence fingerprints—contour-plots of 3D fluorescent spectra—to directly identify the dyes responsible for lending coloration to dyed fabrics. This was the reasoning that motivated the launch of our research program in the early 1990s24). Later, we replaced the F-4010 with our current F-4500 system, developed the optical-fiber approach described above, and expanded the focus of our research from dyed fabrics to ukiyo-e prints25,26). It was at this juncture that we began developing our procedure for making on-site measurements with the F-2500, and since then we have performed non-destructive analyses of ukiyo-e prints at museums throughout Japan and at the Museum of Fine Arts, Boston, USA27). At present, our research is focused on using Hitachi's F-7000 system for non-destructive analysis of lacquers used to make lacquerware.
From the moment we began this research program in the 1990s, and continuing through to the present day, there has been a continual expansion of the capabilities of fluorescence spectrophotometers. Among the advances that we find most valuable are the dramatic reduction in measurement times (facilitated by higher scan speeds), the significantly longer lifetimes of xenon-lamp light sources, and the proliferation of data-analysis functionality. We are also considering Hitachi's F-2700 compact fluorescence spectrophotometer (weight: 41 kg) as a possible replacement for the F-2500 system we currently use for on-site measurements.
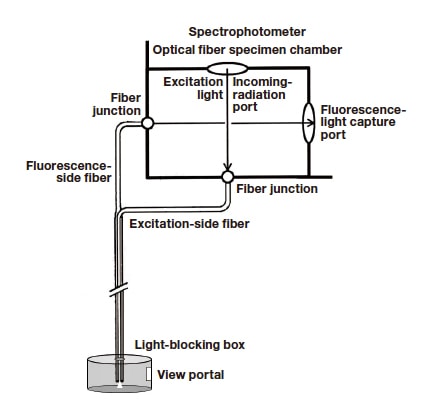
Fig. 24 Optical fiber configuration.
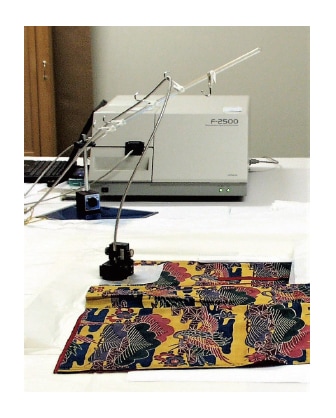
Fig. 25 Measuring 3DF spectra of bingata specimen.
For a specimen of the dye safflower (coloring matter: carthamin), Figure 26 shows the measured 3DF spectrum and its contour-plot representation or fluorescence fingerprint. 3DF spectra are measured by successively irradiating the specimen at a sequence of excitation wavelengths and measuring the fluorescence spectrum at each excitation wavelength. To perform such a measurement, we specify values for various parameters—the excitation wavelength range (typically 250-600 nm), the wavelength interval between successive excitation wavelengths (typically 5 nm), and the wavelength range over which to measure fluorescence spectra for each excitation wavelength (typically 300-700 nm)—then simply initiate the measurement. If we watch in real time as the measurement proceeds, we see a gradual sequence of variations in the fluorescence spectra measured for each excitation wavelength. For typical values of the scan parameters—excitation wavelength ranging from 250 to 600 nm in 5 nm steps—a total of 71 separate fluorescence spectra are measured (Figure 26, left). After the full measurement is complete, these 71 spectral curves are combined to yield a three-dimensional plot (Figure 26, center) depicting the variation of fluorescence intensity with respect to both excitation wavelength (Ex) and fluorescence wavelength (Em). This plot is known as a three-dimensional fluorescence (3DF) spectrum28). Note that this plot is reminiscent of bird's-eye view of a topological map depicting a mountain range; in the same way that a three-dimensional topological map can be converted into a two-dimensional contour map—with the altitude information conveyed by three-dimensional features in the former now encoded by contour lines in the latter—we can convert the 3DF spectral plot (Figure 26, center) into a contour-plot (Figure 26, right). The result, known as a fluorescence fingerprint, furnishes a unique signature to the measured specimen, which may be used, for example, to identify the dyes used to color cloth fibers or to color ukiyo-e prints. The contour-plot shown at the right in Figure 26 is a fluorescence fingerprint measured for the pigment carthamin in the dye safflower, whose molecular structure is shown in the lower central portions of the figure. Because this fluorescence fingerprint is derived from the particular molecular structure of this dye, any other dye—or any other molecular structure—would have a distinct fingerprint.
In forensic science, human fingerprints are used to identify specific individuals. For example, in Japan, fingerprints left at crime scenes (latent fingerprints) are compared against two databases maintained by the Fingerprint Center of Japan's National Police Agency: one database stores the fingerprints of more than 8 million convicted criminals, and a second database contains billions of latent fingerprints left at past crime scenes. Fingerprint comparisons are automated by the Automated Fingerprint Identification System (FAIS), with the final determination as to whether or not a given fingerprint matches a fingerprint in the database being made by an expert forensic analyst29,30).
The use of human fingerprints to identify crime suspects furnishes a partial analog to the use of fluorescence fingerprints to identify dyes in cultural properties. The fluorescence fingerprints measured for a cultural property, which correspond to latent fingerprints left at a crime scene, are compared against fluorescence fingerprints measured for laboratory-prepared standard specimens; if a match is found, we may conclude that the dye used in the cultural property is identical to the dye used to prepare the standard specimen. To construct a reference database of fluorescence fingerprints for known substances, we perform measurements of silk fabric specimens dyed with common natural dyes and of washi paper specimens colorized by pressing natural coloring matters into the paper.
Figure 27 shows fluorescence fingerprints measured for specimens of silk fabric colorized by single dyes and for washi paper colorized by single dyes. When a desired colorization effect cannot be achieved using any one single dye, multiple dyes may be combined; for example, in ancient Japan the colors scarlet and green were each realized by over-dying using two different dyes31). Figure 28 shows a fluorescence fingerprint measured for a standard silk-fabric specimen dyed scarlet by the yellow dye Amur cork (berberine), and then over-dyed with the red dye safflower. Figure 29 shows a fluorescence fingerprint measured for a standard silk-fabric specimen dyed green by the blue dye indigo, and then over-dyed with the yellow dye Amur cork. Figures 28 and 29 also show enlarged subregions of the full fluorescentfootprint images. The low measured values of the fluorescence intensity in these cases have the effect of obscuring contour-line peaks in the full fluorescence fingerprint plots, so we present these enlargements with lower intensities to ensure that contour-line peaks are readily discernible.
As is clear from a comparison of these fluorescence fingerprints, the fluorescence fingerprint measured for a given dye has a unique shape that is characteristic of the dye, with a unique contour-line peak defined by the maximum excitation wavelength (λEx) and the maximum fluorescence wavelength (λEm), which are also characteristic of the dye. In fluorescence fingerprints for specimens dyed scarlet or green by over-dying using two different dyes, we see two distinct contour-line peaks, one produced by each of the dyes. The dyed silk fabrics measured to yield fluorescence fingerprints for our reference database of known colorants were provided by our research collaborator Yasuko Shimoyama, an expert in the field of dyes, while the colorized washi prints measured to yield fluorescence fingerprints for our database were provided by the late Shinya Katsuhara (Painter name: Inuki Tachihara). Note that fluorescence fingerprints (contour-line patterns) measured for fabrics dyed with a given dye should be independent of the type of fabric—which may be silk, hemp, or another fiber—and should be identical to fluorescence fingerprints measured for washi specimens colorized by the same dye.
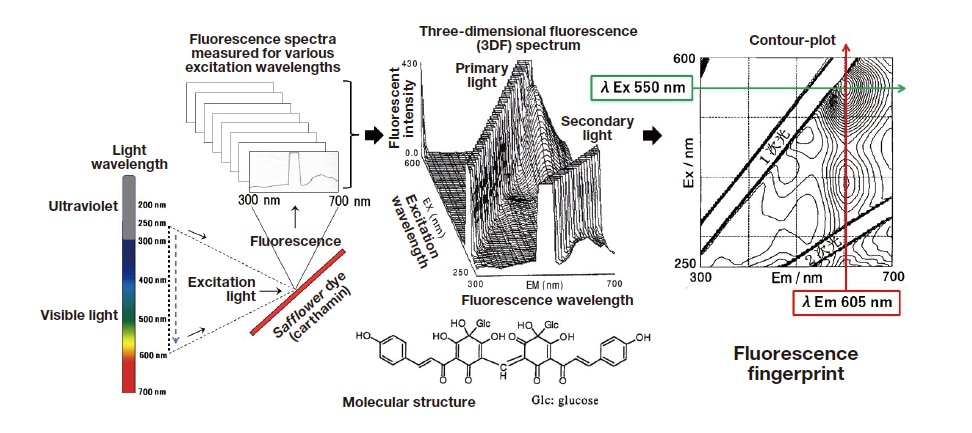
Fig. 26 Measured 3DF spectrum for safflower dye (carthamin) and corresponding contour-plot (or fluorescence fingerprint).
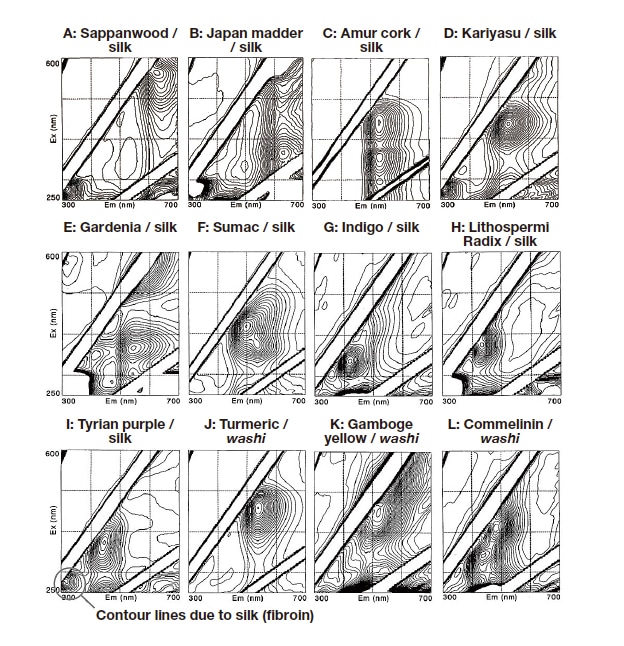
Fig. 27 Fluorescence fingerprints for standard specimens consisting of silk fabrics colorized by single dyes or washi paper colorized by single dyes.
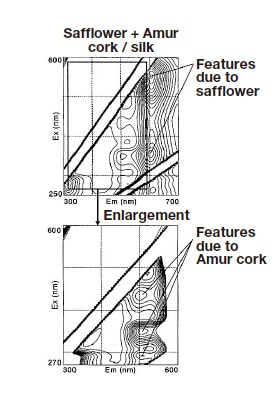
Fig. 28 Fluorescence fingerprints for standard specimens of silk fabrics dyed scarlet by Amur cork, and overdyed with safflower.
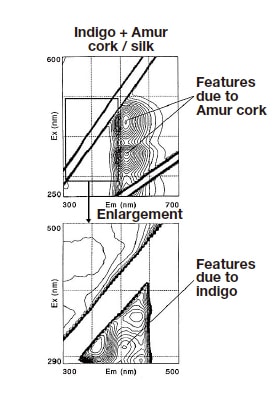
Fig. 29 Fluorescence fingerprints for standard specimens of silk fabrics dyed green by indigo, and over-dyed with Amur cork.
Figure 30 shows a brocade, discovered in 1994 in Lhasa, Tibet, that dates from the 16th or 17th century (from the late Muromachi era to the Azuchi-Momoyama era of Japanese history) and is created from fabric made in China. The decorative motifs woven into this brocade include: a dragon, which was thought to symbolize the Emperor of China, woven from gold thread and incorporating five talons; a cloud, woven from blue and green thread; and a flame woven from scarlet thread. Susumu Shirai, then the chief engineer of Tatsumura Textile Co., Ltd., named this object the "brocade with dragon and cloud patterns on light-brown ground". With dimensions of 290 mm (tall) by 280 mm (wide), the brocade is too large to fit into the specimen chamber of our spectrophotometer; instead, we used our optical-fiber probe setup to make measurements of specific subregions. First, Figure 32 shows the fluorescence fingerprint obtained from measurements (at point X) of the blue thread used to weave the cloud motif shown on the left in Figure 31. This fluorescence fingerprint matches that obtained for the indigo-dyed silk fabric in Figure 27G. Next, Figure 33 shows the fluorescence fingerprint obtained from measurements (at point Y) of the green fabric used to weave the cloud motif. This fluorescence fingerprint matches that obtained for the silk fabric dyed with both indigo and Amur cork in Figure 29. Y1 and Y2 indicate contour-map peaks due to Amur cork dye, while Y3 indicates a contour-map peak due to indigo dye. Finally, Figure 34 shows the fluorescence fingerprint obtained from measurements (at point Z) of the scarlet thread used to weave the flame motif. This fluorescence fingerprint and the peak contour line match the measured data shown in Figure 28 for silk fabric dyed with both safflower and Amur cork. Contour-line peaks Z1 and Z2 are due to safflower dye, while peaks Z3, Z4, and Z5 are due to Amur cork dye. Based on these findings, we conclude that the blue thread woven into the brocade is colored by indigo alone, the green thread is colored by both indigo and Amur cork, and the scarlet thread is colored by both safflower and Amur cork32-34).
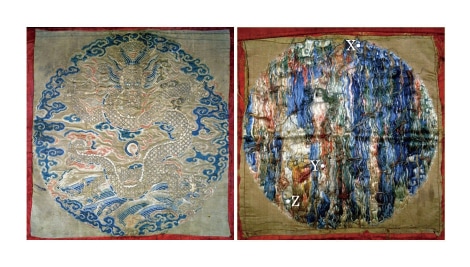
Fig. 30 A brocade dating from the 16th or 17th century and known as the "brocade with dragon and cloud patterns on lightbrown ground". The measurement positions are indicated on the back side of the brocade (right).
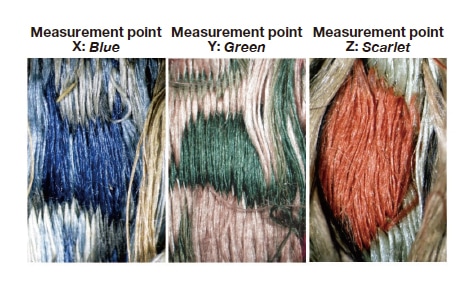
Fig. 31 Measurement points for brocade specimen in Figure 30.
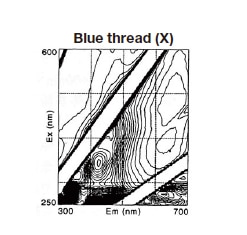
Fig. 32 Fluorescence fingerprint obtained from measurements of blue thread in brocade (measurement point X).
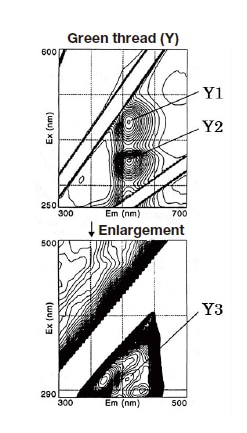
Fig. 33 Fluorescence fingerprint obtained from measurements of green thread in brocade (measurement point Y).

Fig. 34 Fluorescence fingerprint obtained from measurements of scarlet thread in brocade (measurement point Z).
By analyzing measured 3DF spectra and XRF spectra, we showed that a mixture of indigo dye and orpiment (As2O3) pigment was used as a green colorant in a ukiyo-e print35). The ukiyo-e print in question was published around 1821 (Bunsei 4, in the late Edo period) as part of a three-print series by Gototei Kunisada titled "Eight views of Edo: Evening Snow at Mokuboji". Figure 35 shows the fluorescence fingerprint and XRF spectra obtained for a measurement point lying within a green region of the print.
We first note that the fluorescence fingerprint obtained for this green region resembles the fluorescence fingerprint for indigo shown in Figure 27G. However, the maximum-excitation wavelength (λEx), indicated by the peak contour line, is shifted slightly in the long-wavelength direction compared to that for indigo. The presence of elemental As is also detected in this green-colored region, from which we conclude that the yellow pigment orpiment was used. To proceed, we prepared a standard specimen consisting of a mixture of blue-colored indigo and yellow-colored orpiment applied to washi paper, then measured 3DF and XRF spectra for this specimen. As expected, the XRF spectrum for the standard specimen reveals the presence of As, and we obtained the fluorescence fingerprint shown in Figure 36. This fluorescence fingerprint matches that obtained for the green region of the ukiyo-e specimen in Figure 35, and the positions of the peak contour lines (λEx/λEm) match as well. Based on this experimental confirmation, we conclude that the green colorant used at that time, not only in this ukiyo-e print but more generally, was a mixture of indigo and orpiment.
As a side note, this example raises two points of general interest. First, as we see from the fluorescence fingerprint for the green colorant produced by blending indigo and orpiment, features in fluorescence fingerprints due to dyes may appear distorted for specimens that also contain pigments. Second, the presence of paramagnetic ions such as Fe, Ni, Cr, Cu, or Co can dramatically reduce the fluorescence intensity emitted by fluorescent molecules (due to extinction effects), and thus extra care is required in such cases22,36).
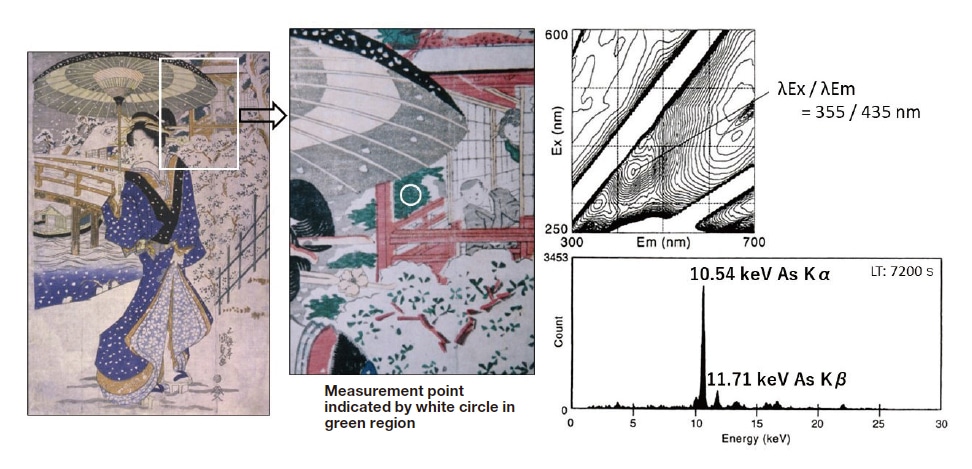
Fig. 35 3DF and XRF spectra measured for ukiyo-e print in series "Eight views of Edo: Evening Snow at Mokuboji".
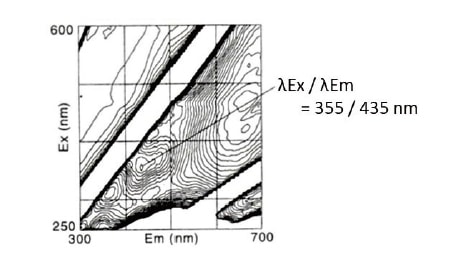
Fig. 36 3DF spectrum measured for standard specimen of green colorant produced by blending orpiment with indigo.
The production of ukiyo-e prints is a multi-stage collaboration between an artist, a sculptor, and a printer. The process begins when the artist gives the sculptor a rough draft of the image to be depicted by the print. The sculptor then prepares several items: a master printing key-block (or omohan) with lettering for the title of the image and the name of the artist, a schematic diagram (an outline sketch) of the image based on the artist's rough draft), and a colorization template (kyougouzuri) used to communicate color information between artist and sculptor. More specifically, the kyougouzuri is a version of the schematic diagram on which the artist adds instructions specifying the colors to be used in various subregions of the image. Based on these instructions, the sculptor then sculpts a set of color blocks—one for each color in the image—that will be used to print the colorized image, one color at a time. Next, the color blocks and the master key-block are delivered to the printer, who first uses the latter to form an outline image on washi paper before proceeding to production with the former. Consequently, the colorants used to produce the various colors in the image are stamped onto the uppermost layer of the washi. If dyes are stamped onto the washi then we can measure their 3DF spectra, while if pigments are stamped onto the washi then we can measure fluorescence emissions from the base layer of the washi (cellulose) itself and use this data as a fluorescence fingerprint.
Figure 37 shows XRF spectra and fluorescence fingerprints measured for a ukiyo-e print by Gototei Kunisada, renamed Utagawa Toyokuni the 3rd, entitled "Eight Views of Floating World: Night Rain at Kioroshi River". This ukiyo-e print was published in 1855 (Ansei 2), after Katsushika Hokusai first used Prussian blue to establish landscape images as a subgenre of ukiyo-e. Thus, by the time this print was published the use of Prussian blue in ukiyo-e prints had become standard.
The upper and lower sets of data plots in Figure 37 respectively indicate results for measurement point A—at which no colorants were stamped—and for measurement point B, at which blue colorant was stamped. Comparing the two datasets, we see that the fluorescence fingerprint for measurement point B—which lies in a blue-colored region of the specimen—matches the fluorescence fingerprint for measurement point A, which lies in an uncolored region. This demonstrates that the fluorescence fingerprint for measurement point B is in fact a fluorescence fingerprint for the washi (cellulose) itself, and that the blue colorant present at point B is a pigment that does not emit fluorescence at ultraviolet or visible wavelengths. Thus, based on the presence of Fe revealed by the measured XRF spectrum for measurement point B, we conclude that the blue pigment used here is Prussian blue. This example demonstrates that it cannot be immediately concluded that dyes were used simply because the fluorescence fingerprint was obtained from that region; one must also consider the fluorescence fingerprint for the background (empty regions or regions at which no colorant is present), and if the fingerprints match one must assume that a pigment has been stamped into the specimen and proceed to XRF analysis.
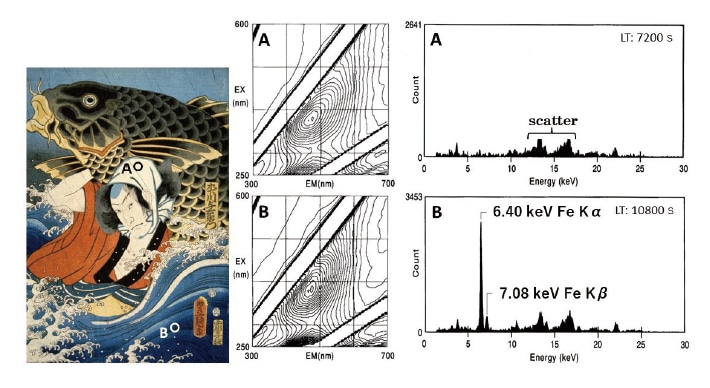
Fig. 37 Fluorescence fingerprints and XRF spectra measured for white (washi) and blue regions of ukiyo-e print "Eight Views of Floating World: Night Rain at Kioroshi River".
The study of bygone eras can yield valuable new insights and perspectives. Here we discuss a novel twist on this idea of learning from the past. Through our studies of colorants used for cultural properties in previous eras, we discovered a new type of optical functionality, which was successfully exploited to develop new commercial products of use in the modern world37).
The fluorescence fingerprint for safflower shown in Figure 26 indicates absorption and excitation of 550 nm light with emission of 605 nm light. 550 nm light is seen by humans as green, while 605 nm light is seen as yellowish-red (or reddish orange). Interpreting this phenomenon as a demonstration of the functional optical capabilities of safflower, we investigated the possibility of exploiting this phenomenon to productive ends in the modern world. In contrast to LED light sources, which are now starting to become ubiquitous, the light sources used most often in previous eras included daylight fluorescent lamps and white fluorescent lamps. As any makeup artist can attest, even the most beautifully accentuated face can appear sallow under a fluorescent lamp. The reason for this, as shown in Figure 38, is that these fluorescent lamps emit blue-tinted and green-tinted light with high intensity, but emit almost no red-tinted light. This is the origin of the disappointing appearance of cosmetics when viewed under fluorescent lamps. But this diagnosis suggests a potential remedy: If one could find a substance with a particular optical functionality—specifically, the ability to absorb and eliminate blue-tinted and green-tinted light while generating red-tinted light—then this substance could be added to cosmetic products to mitigate the undesirable phenomenon described above. To test this idea we dyed cellulose with safflower, ground the cellulose into a fine powder, and added it to foundation and other cosmetic powders. This led to the emergence of new commercial products released in 1994 by the Japanese cosmetic firms Shiseido and Chifure38,39).
On a separate but related note, in Europe, the red colorant cochineal (carminic acid) has been one of the most widely used colorants ever since the birth of lipstick. Cochineal does not fluoresce even when irradiated by ultraviolet light. However, blending cochineal with safflower has the effect of shifting the maximum fluorescence wavelength of safflower from 605 nm to longer wavelengths, and values in the range 625-635 nm (λEm/λEx ranging from 625/545 to 635/400 nm) were found to produce red-tinted light. Based on this discovery, in 2005 the French cosmetic firm Chanel introduced a lipstick named "AKA" for sale exclusively in Japan (Figure 39).
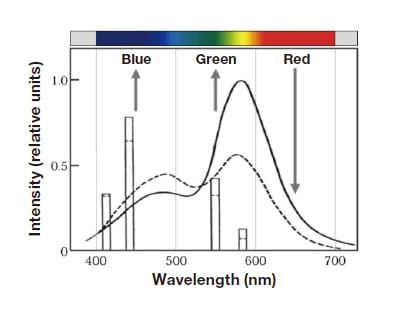
Fig. 38 Coloration of light emitted from fluorescent light sources. Solid curve: Daylight fluorescent lamp. Dashed curve: White fluorescent lamp.
Fig. 39 Chanel's AKA lipstick.
In this article we presented a collection of measurement techniques we have developed for non-destructive analysis of the colorants used in cultural properties. Our approach, which we have deployed and are continuing to deploy in a wide range of practical scenarios, involves collecting and analyzing five mutually complementary sets of experimental data: infrared photographs, microscopy images, visible/near-infrared reflection spectra, X-ray fluorescence spectra, and three-dimensional fluorescence spectra. For each type of data, we described the experimental procedures and analytical instruments used to perform the measurements, discussed the interpretation of the data and the information that may be derived from it, and presented practical case studies involving pigments and dyes used in cultural properties. Colorants may be pigments, dyes, or mixtures of both, and no single experimental approach could possibly suffice to lend full insight into both possibilities. At the very least, one requires a minimum of two types of analysis: X-ray spectroscopy, to investigate the elemental composition of pigments, and fluorescence spectroscopy (three-dimensional fluorescence spectra), to analyze dyes; moreover, the procedures and instruments used for these analyses must be amenable to onsite measurements at museums or other remote sites at which cultural properties are curated. As we demonstrated, the insights delivered by these two types of spectroscopy are richly complemented by other types of data, which—despite being somewhat classical in nature—furnish valuable insights and lend comprehensive understanding: infrared photographs, microscopy images depicting enlarged views of fine-grained structures, and visible/near-infrared reflection spectra.
Finally, in analyzing colorants in cultural properties our discussion emphasized the importance of combining experimental data with other types of knowledge—including awareness of the physical and chemical properties of colorants, understanding of the historical factors responsible for the introduction of various types of colorants, and an appreciation of the techniques by which cultural properties were created—to foster the broad multidisciplinary mindset required for a proper interpretation of measured data.
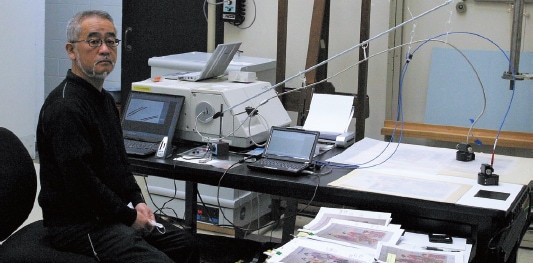
An on-site analysis in progress at the Museum of Fine Arts, Boston.
Acknowledgements
Our research has been made possible by the generous assistance of many individuals who have provided opportunities to work closely with precious cultural properties. It is thanks to these individuals that we have been able to perform non-destructive analyses to study pigments, dyes, and other materials used to colorize famous works of art, and we are grateful for their assistance. In particular, we acknowledge the following institutions for offering access to the cultural properties discussed in the text.
- Hiroshima Museum of Art
•“Daubigny’s Garden”, oil painting (Figures 2,4)
- Naha City Museum of History
•Japanese National Treasure: Naha-15-, Bingata-07-07, Bingata garment (Figures 5,7,16)
•Japanese National Treasure: Naha-20-, Bingata-12-12, Bingata garment (Figures 8,14)
•Japanese National Treasure: Naha-26-, Bingata-18-18, Bingata garment (Figure 20)
•Japanese National Treasure: Naha-80-, Earthenware-01, Square-base candle stand with green Ryoku-Yu glaze (Figures 17,23)
•Japanese National Treasure: Naha-77-, Lacquerware-09, Tsuikin-decorated black-lacquered wood tray (Figure 22)
- Hagi Uragami Museum
•Katsushika Hokusai, "Thirty-Six Views of Mount Fuji" (Front views of Mount Fuji) (Figure 13)
- Asakura Shrine, Fukui Prefecture
•Images of Rashomon (Figure 21)
References
See more
