Mari Sakaue*1, WeiChean Tan*2
Recent advances in nanotechnology have accelerated the progress of miniaturization and fine-grained processing in many fields, including semiconductors, advanced materials, and electronic components. For this reason, contamination by microscopic impurities—not considered a significant problem in the past—has become a major cause of functional impairments in high-precision components.
To date, component impurity scanning has largely been conducted via optical microscopy, but the spatial resolution of optical microscopes is no longer sufficient to characterize the ever-shrinking sizes and ever-improving quality of precision components, creating a growing need for SEM-based impurity-scanning methods that offer higher spatial resolution and greater depth of focus. The process of impurity scanning requires instrument operators to acquire large numbers of images—determined by the number of test bodies and the purpose of the investigation—and to detect impurities within each image. For SEM-based impurity scanning, the successive image-acquisition capabilities of modern instruments may be exploited to acquire large numbers of images, to which image-processing algorithms may be applied to detect impurities.
Typical image-processing methods for impurity detection use brightness values in images to identify impurities. However, methods of this sort frequently fail to catch impurities in cases where the brightness of the impurity differs only slightly from that of the background, as illustrated by impurity A in Figure 1. In such cases, testing personnel must resort to visual inspection of images on display screens to detect and count impurities—an enormous operational burden. To address this problem, we have proposed a new approach to the detection of impurities in SEM images, for which we have developed and tested a software package based on an artificial-intelligence (AI) engine. As shown in Figure 2, our AI-powered technique succeeds where conventional methods fail by accurately detecting impurity A, thus facilitating automated impurity scanning.
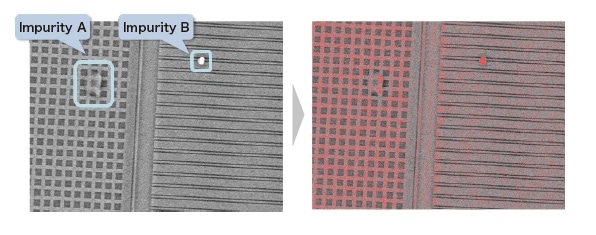
Fig. 1 Results of conventional image-processing methods, which fail to detect impurity A.
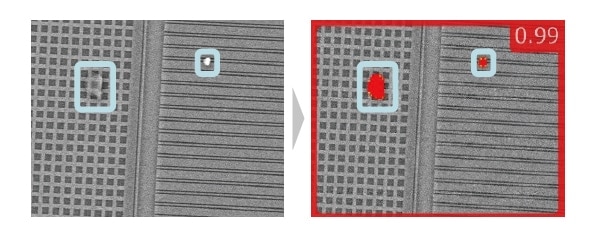
Fig. 2 Results of impurity detection using the new AI-powered image-recognition technique, which correctly detects impurity A.
We present EM-AI, a newly available option for Hitachi SEM instruments that exploits our new technique for automated detection of impurities.
We chose Hitachi’s compact FlexSEM 1000 II instrument as the first SEM system on which to install EM-AI. Shown in Figure 3, the FlexSEM 1000 II is an improved version of the FlexSEM 1000—introduced in the April 2017 issue of the Japanese publication Engineering Materials—featuring an improved sample stage with enhanced vibration isolation and the optional Multi Zigzag feature, which enables automated image acquisition for multiple sample regions. To accommodate a wide range of installation environments and meet the needs of all users, the instrument has been redesigned to boast a reduced installation footprint—without sacrificing its high resolution—and now offers a choice of low-vacuum and high-vacuum modes for the vacuum exhaust system, to be selected as appropriate for the application in question.
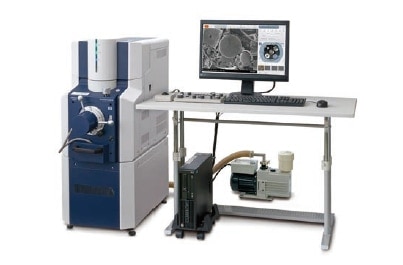
Fig. 3 The FlexSEM 1000 II
EM-AI is an automated impurity-detection system that links the FlexSEM 1000 II with the sample stage and combines A I-powered i mage-recognition t echnique w ith methods for a utomated s uccessive i mage a cquisition for multiple test bodies with SEM. As an additional feature, upon detection of an impurity the system can automatically translate the sample stage to the location of the impurity for detailed observation and analysis.
A standard feature of the FlexSEM 1000 II is SEM MAP, an intuitive approach to field-of-view searching that greatly reduces the time and effort required for this task. SEM MAP uses optical sample images—captured before the start of SEM observation specifically for use in field-of-view searching—and pastes these on a map representing the interior of the specimen chamber to construct a guide for sample navigation. The optical images in the map retain coordinate and magnification information, enabling the use of mouse-drag motion within the map to move to an observed field of view or specify measurement regions.
Another useful feature is Multi Zigzag, which uses SEM MAP to enable simultaneous specification of multiple sample regions for successive acquisition of SEM images. Figure 4 illustrates the use of Multi Zigzag to specify multiple sample regions. This feature also allows duplication of imaged regions and enables operators to fix the delineation of regions of interest and acquire images from multiple samples in succession, reducing the operational effort required to acquire large numbers of images for automated impurity analysis. The EM-AI system for automated impurity detection can use these features to process image data acquired from multiple samples in succession.
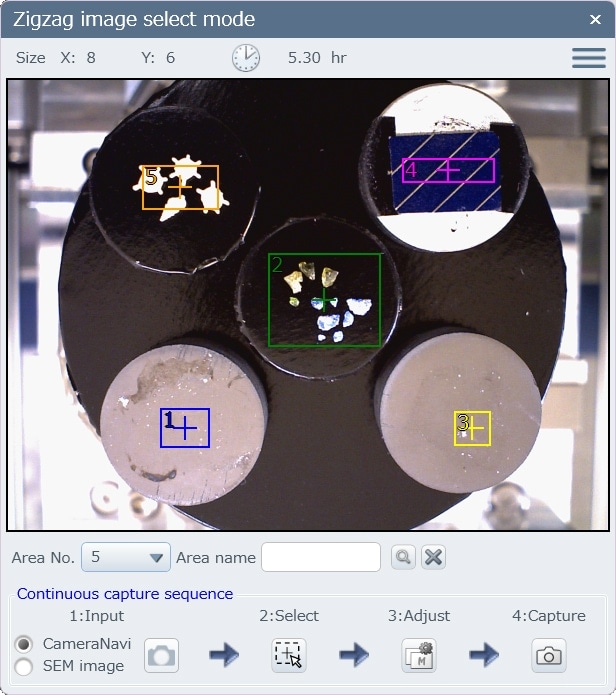
Fig. 4 Using Multi Zigzag to specify multiple sample regions.
The use of EM-AI allows users to automate the measurement process from SEM observation to particle analysis with no need for expert-level knowledge. The first step in the impurity-detection process is to execute a deep-learning algorithm to “educate” the AI engine about impurities. Machine-learning methods for impurity detection may be classified into two categories. One approach, useful in situations where impurities are relatively rare, is to register images of high-quality (impurity-free) sample morphologies in advance, prior to attempting to detect the presence of impurities. The other approach, useful in cases where impurities are common or exhibit characteristic features, is to use machine-learning techniques to teach the engine about the shapes and textures of impurities. Figure 5 shows an example of the use of high-quality samples to educate the engine. In this case we prepared over 20 images of highquality samples—here, a Cu mesh with no impurities present—and used these to educate the engine, after which the use of EM-AI for impurity detection successfully identified impurities on the Cu mesh, as shown in the figure.
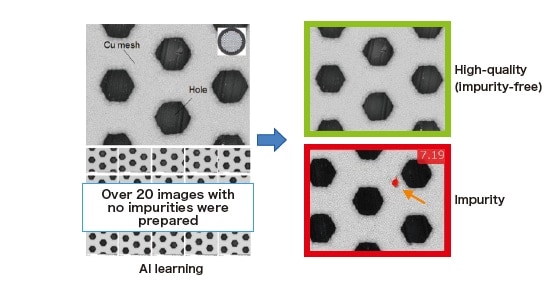
Fig. 5 An example of successful impurity detection after using impurity-free samples to educate the AI engine.
Next, Figure 6 shows an example in which the engine was made to learn impurity shapes and textures. The sample in this case consists of asbestos fibers collected on a filter. The asbestos fibers in this image vary significantly in diameter, and—in particular—fibers of small diameters are difficult to detect via impurity-detection systems based on conventional image-processing methods, due to the difficulty of distinguishing the brightness of impurities (asbestos fibers) from that of the background (the filter). In this case we train our AI engine by manually selecting and labeling specific impurities using the Pen Tool feature of the software. Figure 7 shows the results of impurity detection after educating the engine with a training set containing more than 20 images of high-quality samples with the filter only and more than 20 images of unacceptable samples with asbestos fibers present on the filter.
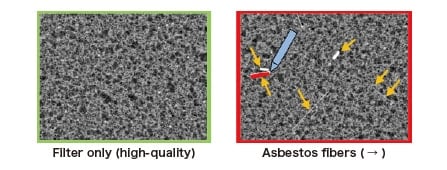
Fig. 6 An example in which the AI engine was trained to identify asbestos fibers on a filter.
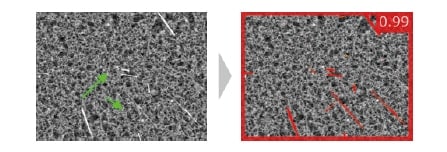
Fig. 7 AI-powered automated detection of asbestos.
Results obtained after the learning procedure indicate successful automated detection of small asbestos fibers (→), despite the small contrast differential with the filter. This demonstrates that judicious deployment of machinelearning techniques for impurity detection can improve detection accuracy for impurities that are difficult to detect in conventional impurity-detection systems.
Figure 8 illustrates the typical workflow of an EM-AI analysis. By combining successive image acquisition for multiple sample regions using SEM discussed above with AI methods for impurity detection, the process from SEM observation to particle analysis may be automated. For particle analysis, the addition of a particle-analysis engine enables additional tasks—including configuration of various particle-related thresholds and automated analysis of more fine-grained quantities such as particle-size distributions and particle counts—to be performed simultaneously with impurity detection.
The ability of EM-AI to perform automated successive analyses of multiple sample regions—or multiple samples— greatly reduces the time commitment required of instrument operators, significantly improving operational efficiency.
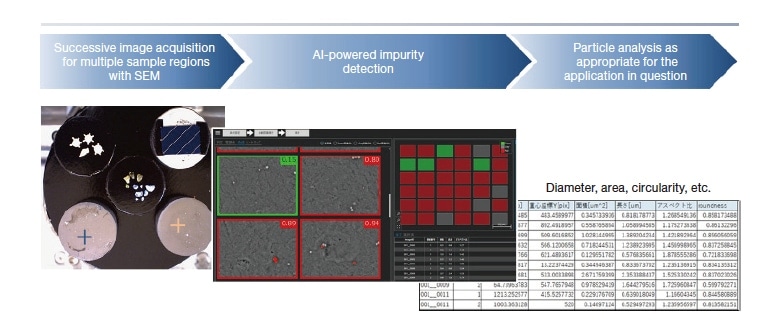
Fig. 8 Operational flowchart of a typical EM-AI session.
Next we present a case study in which the EM-AI automated particle analysis system is used to detect only specific particles. The sample is a mixture of latex particles and diamond-dust particles with nearly identical particle sizes and similar compositions. Our goal is to detect only the diamond particles for identification as impurities. First we use deep learning to train the AI engine to ignore latex (round particles) and detect only diamond particles; Figure 9 shows results obtained with a 40-image training data set. Next, Figure 10 shows the results of EM-AI automated particle analysis for 100 fields of view using the training file prepared here. In addition to a summary display of the SEM-specified region ① , automatically acquired wide-area image data for that region ② , and the status of particle detection ③ , it is also possible to display—or generate comprehensive reports describing—results from specified particle analysis such as automated measurements of the diameters of detected particles ④ .
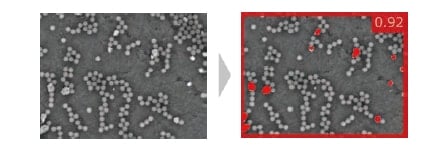
Fig. 9 Using AI learning to detect specific particles. In this case we detect only diamond particles.
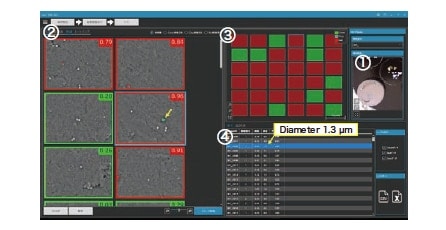
Fig. 10 Summary view showing automatically acquired wide-area image data and status of particle detection.
In this paper, we showed how the EM-AI system for impurity detection exploits deep-learning methods—enabled by AI technology—to enable detection of impurities that pose difficulties for conventional image-processing techniques. By using application-specific data to train its AI engine, EM-AI enables the design and implementation of highly flexible analytical systems that avoid specialization to any particular application. Going forward, we hope to contribute to fields such as materials analysis and quality control by rolling out the EM-AI system to other electron microscopes and providing instruments equipped with cutting-edge technologies for cutting-edge applications.
Publication data
Published in the monthly journal Engineering Materials (November issue 2019)
About the author
Analysis Systems Solution Development Department
Metrology and Analysis Systems Product Division
Nano-Technology Solution Business Group
Hitachi High-Tech Corporation
Analysis Systems Software Design Department
Metrology and Analysis Systems Product Division
Nano-Technology Solution Business Group
Hitachi High-Tech Corporation
See more
