
Junhyeok Jang
Tokyo Metropolitan University,
Graduate School of Urban Environmental Sciences,
Third year student of the Doctoral Course

Hirohisa Yoshida
Tokyo Metropolitan University,
Graduate School of Urban Environmental Sciences,
Professor
In general, macromolecular products are more often produced by blending multiple macromolecular compounds than by construction from unique macromolecules. In macromolecular blends, the macromolecular chains are long, so the multiple macromolecular compounds are not usually mutually miscible, and they undergo phase separation. The magnitude of phase separation depends on the intensity of phase interactions between the macromolecules, and there is a spectrum, from microphase separation, involving phase sizes in the micrometer range or lower, to macrophase separation. Therefore, in macromolecular blends there are interfaces between phase-separated macromolecular phases. The interface thicknesses and macromolecular composition gradients differ according to the magnitude of interactions between the macromolecules, and the condition of the interfaces affects mechanical strength and other physicochemical properties when the macromolecular products are used as materials. This report presents examples of characterization of phase-separation interfaces, primarily in macromolecular blends, using atomic force microscopy (AFM) and differential scanning calorimetry (DSC).
Whereas mixtures of nitrogen and oxygen are formed as a result of mixing entropic gain (entropic effects), when mixing water and alcohols the balance between entropy and enthalpy is important. For example, when primary alcohols in the series from methanol (CH3OH) to octanol (C8H17OH) are mixed with water, phase separations of butanol (C4H9OH) and higher alcohols are observed at room temperature. The mixing between water and alcohol is a result of hydrogen bonds formed by hydroxyl groups, but hydrophobic alkyl groups form defects within the network of hydrogen bonds, and the alkyl groups themselves thus come into contact. With longer alkyl groups, the water network is disrupted by hydrophobic interactions, so mixing with water becomes difficult, and phase separation occurs. In the case of bilayer phase separation, the upper layer is an alcohol phase containing a small amount of water, and the lower layer is an aqueous phase containing a small amount of alcohol. Whereas, in a water/octanol mixture system, the interface between the two layers can be clearly seen, in a water/butanol mixture system the interface is indistinct. This is due to differences between the two systems with respect to the water/alcohol composition gradient at the interface, and in both cases the composition gradient thus reflects the mixture status. If a mixed solution of water and alcohol is shaken thoroughly, and then left at rest, it can be seen that small water bubbles are formed, and come into contact with each other, so phase separation progresses. Phase separation progresses rapidly in a water/octanol system, but more slowly in a water/butanol system.
In the case of mixing of two or more macromolecules, the long macromolecular chains mean that entropic effects do not occur, and whether or not mixing occurs depends solely on enthalpic effects. In other words, some mixing does occur between macromolecules, due to the effects of strong attractive interactions such as the hydrogen bonds in a water/alcohol system, but that combination is uncommon, and most of the interactions in macromolecular blends are repulsive, resulting in phase separation. In the case of macromolecular blends in which attractive interactions are effective, the mixture status can be determined on the basis of the phase diagram for the lower critical solution temperature (LCST; Fig. 1a), and in blends in which repulsive interactions are effective the status is determined on the basis of the phase diagram for the upper critical solution temperature (UCST; Fig. 1b). The solid lines in the phase diagrams are the coexistence curves, and phase separation occurs under the conditions on the inner sides of the curves. In other words, in blend systems in which attractive interactions are effective, mixing occurs at low temperatures, but when temperatures increase molecular mobility becomes more active, and phase separation occurs when this mobility exceeds the attractive forces.
In an actual blend system, depending on how the changes in glass transition temperature in the mixture system relate to the phase diagrams, the phase structure may be affected. At temperatures below the glass transition temperature, translational mobility of the macromolecular chains is frozen, and the phase structure, present at temperatures above the glass transition temperature, is therefore frozen.
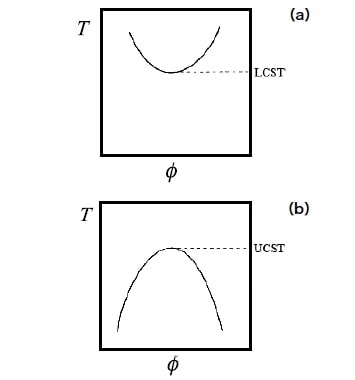
Fig. 1 LCST phase diagram (a) and UCST phase diagram (b)
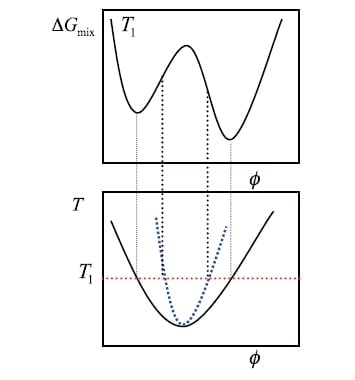
Fig. 2 LCST phase diagram (below) and mixing Gibbs energy composition changes at temperature T1 (above)
Figure 2 shows phase diagrams for LCST, and composition changes for mixing Gibbs energy changes (ΔGmix) at temperature T1. The coexistence curve shows the set of compositions for which, in a thermodynamic state of equal temperature and equal pressure, changes in the composition (φ) of mixing Gibbs energy changes are minimal (δGmix/δφ = 0). The spinodle curve on the inner side of the coexistence curve, shows the set of compositions for which the gradient of the changes in the composition of ΔGmix are maximal (δ2ΔGmix/δφ2 = 0). The phase separated in the composition on the inner side of the curve is unstable, and composition changes progress rapidly toward the coexistence composition. This phase separation process is termed "spinodal decomposition", and is characterized by indefinite phase-separation morphology. On the other hand, under the conditions pertaining between the spinodal and coexistence curves, if phase separation occurs, phase-separation nuclei form with the composition shown by the coexistence curve. Phase-separation nuclei grow with time, and this phase separation process, termed "nucleation and growth", is characterized by spheroidal phase structure.
Polyisoprene (IR) and polybutadiene (BR) are used as rubber-like materials in various manufactured products. IR and BR are immiscible, and blends of these compounds are therefore phase-separated, but a homogeneous solution is prepared, irrespective of the blend composition, if the macromolecule concentration is 4%, and both substances are dissolved in toluene. Figure 3 shows AFM phase images of thin film prepared by spin-coating a silicon wafer with a toluene solution of IR/BR. The pale areas are the IR phase, the dark areas are the BR phase, and both phases are undefined, with phase separation having progressed as a result of spinodal decomposition. The solubility parameters for the three components were as follows: toluene: 18.21 MPa1/2; IR: 16.57 MPa1/2; and BR: 17.59 MPa1/2. The degree of mixing between pairs of compounds increases with decreasing difference between the solubility parameters, so BR should have higher solubility in toluene than IR, and when the levels of solubility in toluene were actually measured, that for BR was higher than that for IR. Therefore, when the composition of a blend is 0.5 each for IR and BR, IR with the lower solubility, undergoes phase separation first, and forms precipitate domains, whereas BR forms the matrix.
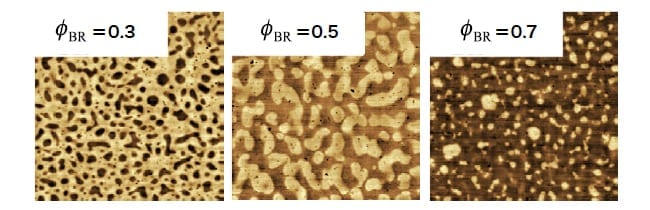
Fig. 3 AFM phase images of thin films prepared by spin-coating from toluene solutions of IR/BR. The numeric values are the proportions of BR contained. The size of each image is 10 × 10 µm.
In other words, in the case of phase separation by spin-coating or solvent casting from a macromolecule blend solution, the differences from the solvent with respect to solubility parameters determine the phase-separation structure. Even with immiscible blends that have the same composition, the phase-separation structure differs according to the solvent used for mixing. Figure 4 shows AFM phase images of the phase-separation structures of thin films prepared from blend solutions containing styrene-butadiene rubber (SBR) and acrylonitrile-butadiene rubber (NBR) in different solvents. In the upper row, the thin films were prepared from toluene solutions, whereas in the lower row they were prepared from tetrahydrofuran (THF) solutions. The pale areas are the SBR-rich phase, whereas the dark areas are the NBR-rich phase. With a composition of 0.5 each for SBR and NBR, when prepared from toluene solution, the spheroidal domains constitute the NBR-rich phase, whereas when prepared from THF solution the spheroidal domains constitute the SBR-rich phase. The domains can be seen to be contrasted with the matrix. The causes of these differences are the differences in three-body interactions between NBR, SBR, and the solvent. The solubility parameters for the solvents were 18.2 and 18.6 MPa1/2 for toluene and THF, respectively, whereas those for NBR and SBR were 19.9 and 17 MPa1/2, respectively. Whereas SBR was more soluble than NBR when the solvent was toluene, NBR was more soluble when the solvent was THF. Therefore, when a thin film is prepared from toluene solution, NBR is precipitated first, spheroidal domains are formed, and SBR, which is more soluble, forms the matrix. With THF solution, however, the situation is the opposite, with SBR domains and NBR matrix forming in the thin film.
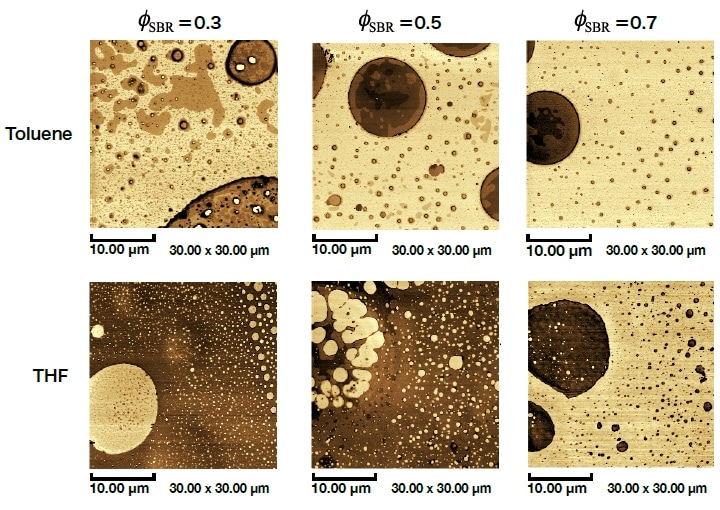
Fig. 4 AFM phase images of thin films of SBR/NBR blend prepared by spin-coating. The upper and lower rows show films prepared from toluene and THF solutions, respectively. The numeric values are the proportions of SBR contained. The size of each image is 30 × 30 µm.
When histogram analysis of phase differences is carried out for phase image data, the surface ratios for the domains and matrix, and the mixture statuses, can be determined. Figures 4 and 5 show the results of histogram analysis of phase images. The SBR phase has the larger phase difference, and the NBR phase the smaller one. The number of histogram peaks corresponds to the number of separated phases, and it is considered that the phase-separation structure is made up of three to five phases, rather than just two (the SBR-rich and NBR-rich phases). In addition, φ*SBR, in the figures, is the SBR content obtained from the histograms, and, whereas in the case of the thin film prepared from the THF solution this was highly consistent with the blend composition, in the case of the thin film prepared from toluene solution the composition obtained by histogram analysis was greater. This difference is due to the differences in dissolution status of NBR and SBR in THF and toluene solutions. As the method for evaluating the dissolution status of macromolecular chains in solution, the radius of gyration (Rg) is obtained, as an index of the extension of molecular chains in solution. Rg can be measured using dynamic light scattering, and in THF solution the Rg values were 145 and 51.4 nm for NBR and SBR, respectively, whereas in toluene solution they were 23 and 94.1 nm. NBR has higher solubility in THF, whereas SBR has higher solubility in toluene. The Rg values show that NBR in toluene solution undergoes almost no swelling due to the solvent, and is dispersed, in the form of aggregates. Therefore, even when a thin film is formed by evaporation of the solvent, the NBR phase has a small surface area, and the SBR content obtained from the histograms (φ*SBR) is even greater than the measured composition (φSBR).
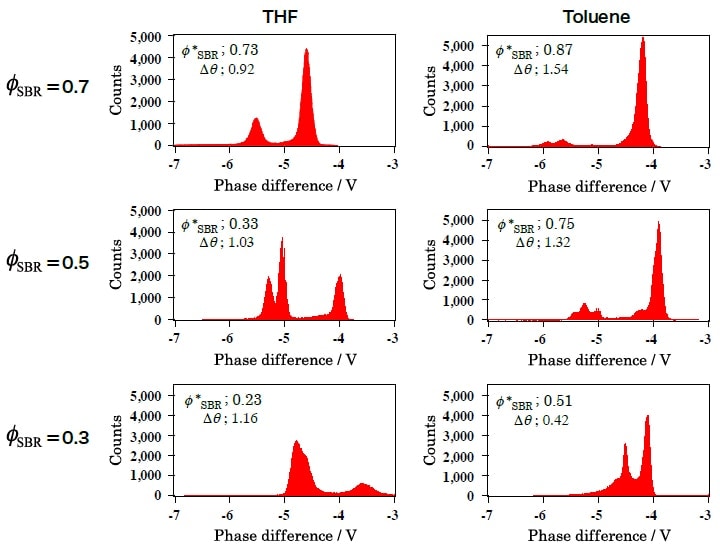
Fig. 5 Analysis of AFM phase image histograms for SBR/NBR blend thin films. The right and left columns show the data for thin films prepared by spin-coating from toluene and THF solutions, respectively. The numeric values show the SBR contents.
In addition, the differences between the NBR and SBR mixture statuses in toluene and THF solutions are also causes of the differences between φ*SBR and φSBR. The phase difference (θ) in the phase image does not reflect the mixture status, and changes with measurement conditions. However, the relative difference (Δθ) of the phase difference between the NBR-rich and SBR-rich phases in the histograms do reflect the NBR and SBR mixture statuses. Figure 6 shows the composition dependence of the relative phase difference (Δθ) between the NBR-rich and SBR-rich phases. The red and blue circles indicate thin films prepared from toluene and THF solutions, respectively. As Δθ decreases, the difference between the compositions of the two phases also decreases, meaning that the mixture is mixed more thoroughly. The composition dependence of the mixture status of THF solution is only slight, whereas the findings suggest that in toluene solution the mixture status improves with decreasing SBR content.
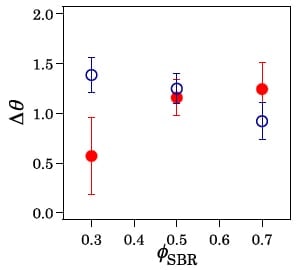
Fig. 6 Composition dependence of relative phase difference (Δθ) obtained by histogram analysis of AFM phase images of SBR/NBR blend thin films. The red and blue circles indicate thin films prepared from toluene and THF solutions, respectively.
When line profiles are obtained in the directions of the spheroidal domain diameters in phase images, the regions of phase difference between the NBR-rich and SBR-rich phases can be clearly evaluated. A phase-separation interface is formed between these phases, and the thickness of this interface can be determined. Using multiple domains in the AFM phase images at different loci, the thickness of the phase-separation interface (lIF) was evaluated. The phase dependence of the thickness of phase-separation interfaces evaluated for spheroidal domains of different diameters (no more than 3 µm, and at least 10 µm) are shown in Fig. 7. The consistency of mixing of NBR and SBR increased with interface thickness. The phase-separation interface was thicker for thin films prepared from toluene solution, and, in particular, it was clearly shown that the mixture status improved with decreasing content of SBR in domains more than 10 μm in diameter. These findings are highly consistent with the mixture statuses suggested by histogram analysis.
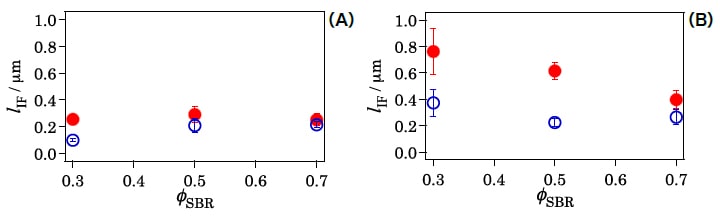
Fig. 7 Composition dependence of the phase-separation interface thickness (lIF) obtained from line profiles of AFM phase images of SBR/NBR blend thin films. The red and blue circles indicate the thin films prepared from toluene and THF solutions, respectively. (A) and (B) indicate domains of no more than 3 µm, and at least 10 µm, respectively.
Assessment of the mixture status of the NBR/SBR thin film was possible on the basis of different evaluations for histogram analysis and line-profile analysis of the AFM phase images. However, the AFM assessment range is one of micro-dimensions, from 10 to 30 µm, and a remaining question is that of application to macro-evaluation, if measurement is carried out with the locus changed. Thermal analysis is a typical method for evaluation of macrocharacteristics. With NBR/SBR and IR/BR blends, the weight fraction of the phase-separation interface can be evaluated on the basis of the heat capacity difference (ΔCp) at the glass transition. For example, in the case of the NBR/SBR blend, two glass transitions were found, for the phase-separated NBR and SBR phases. The glass transition temperature and heat capacity difference for simple SBR were 216 K (Tg*SBR) and 0.41 J/g (ΔCp*SBR), respectively, and those for simple NBR were 238.8 K (Tg*SBR) and 0.49 J/g (ΔCp*SBR). Using the actual measurements (ΔCpNBR and ΔCpSBR) for NBR/SBR blends with different compositions, the NBR and SBR fractions (φ 1F*NBR and φ 1F*SBR) in the phase-separation interface are given by the following equation:
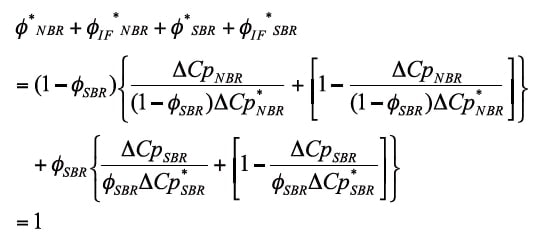
In this context, φ*NBR and φ*SBR are the fractions of phase-separated NBR-rich and SBR-rich phases, respectively. The phase-separation interface fractions measured by DSC, the phase-separation interface thicknesses evaluated by AFM, and the effects of solvents on both, are shown in Fig. 8. When the case with an SBR content of 0.5 was excluded, the phase-separation interface fraction and interface thickness were found to be highly consistent. The thin film prepared from toluene solution had a greater phase-separation interface fraction than that prepared from THF solution, and also showed a thick interface, and thorough mixing of NBR and SBR. Whereas the phase-separation interface thickness was evaluated on the basis of two-dimensional extension in the vicinity of the domains, the phase-separation interface fraction was evaluated on a three-dimensional basis. When the SBR content is 0.5, the domains and matrix are reversed, with both toluene and THF, but there are considered to have been differences between microanalysis and macroanalysis.
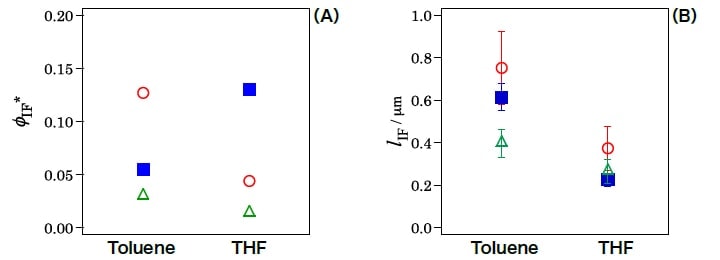
Fig. 8 For SBR/NBR thin films, composition dependence of phase-separation interface fractions (A) obtained by DSC measurement, and phase-separation interface thicknesses (B) obtained from AFM phase images. The red circles, blue circles, and triangles indicate the values when φSBR is 0.3, 0.5, and 0.7, respectively.
Examples of characterization of the phase-separation interfaces of macromolecular blends by AFM and DSC are presented. Interface information obtained by micro-observation AFM showed the mixture status between macromolecules, and showed a high level of consistency with the results of evaluation of the weight fraction of the phase-separation interface, which is a macro-characteristic obtained from the glass transition measured by DSC. Interface evaluation of the NBR/SBR system, as introduced here, was detailed in a previous report1). Analysis of the phase structure by AFM was carried out on the basis of cross-sectional observation of the blend system prepared by industrial techniques other than the solvent cast method2).
References
See more
