
Takeshi Fukuma
Professor, Doctor of Engineering
Division of Electrical Engineering and Computer Science
Kanazawa University
The corrosion of metals is a serious problem in many fields of industry. Examples of the many materials affected by this problem include (a) stainless steels used in nuclear power plants, seawater desalination plants, chemical plants, and other facilities, (b) ultraminiature copper interconnects used in semiconductor devices, and (c) aluminum alloys used to produce automobiles and robots, to name but a few. Previous research has estimated that economic losses due to metal corrosion may be as high as 3-4% of GNP,1) and signifi cant effort has been expended to improve technologies for predicting and preventing this problem.
Corrosion is a phenomenon in which metallic materials suffer degradation due to the oxidation of surface atoms at metal/water interfaces. These oxidation reactions increase the concentration of positive ions (or reduce the concentration of negative ions) in solution near the metal surface, producing an excess of electrons in the metal. In order for these reactions to proceed sustainably, the excess electrons must be consumed at other locations. The typical mechanism for this involves reduction reactions of oxygen and hydrogen ions; however, regardless of the mechanism, a common result arising in all cases is a decrease in the positive-ion concentration (or an increase in the negativeion concentration) near the metal-water interface. Sites at which these oxidation and reduction reactions occur are termed anodes and cathodes respectively, and an anode-cathode pair is called a corrosion cell; as shown in Figure 1a, corrosion cells are thought to carry out the primary steps in the corrosion process.
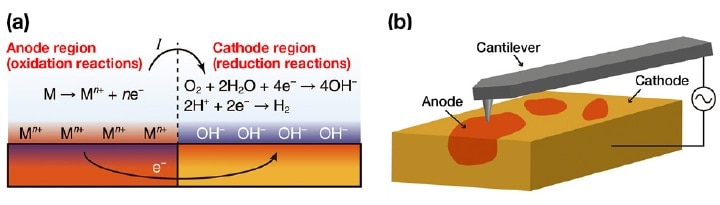
Fig 1. (a) A typical corrosion reaction. (b) Using OL-EPM to visualize a local corrosion cell7).
In the past, most corrosion research involved macro-scale electrochemical measurements.1) To date, the interrelation among electrochemical potentials, currents, timescales, temperatures, solution conditions, and other factors affecting the corrosion process have been studied quantitatively and comprehensively for a variety of metals, and a basic understanding of the macroscopic aspects of corrosion phenomena has been established. However, information obtained by classical electrochemical measurement techniques does not reflect local behavior, and for this reason microscopy techniques have been the primary tool used to study corrosion behavior at the nanoscale. Changes in surface structure associated with corrosion have been investigated via both ex-situ analyses using electron microscopy and in-situ analyses using scanning tunneling microscopy (STM) and atomic force microscopy (AFM).
Despite past efforts in this direction, to date there have been no in-situ observations of the nanoscale distribution of local corrosion cells. The formation of corrosion cells is one of the most basic and important notions in corrosion science, and their existence has been postulated in numerous cases to explain nanoscale corrosion behavior. Thus, it is no exaggeration to say that the absence of experimental methods for determining the distribution of corrosion cells poses an extremely serious problem for the field of corrosion science. For example, the corrosion of copper in purified water proceeds via the transport of charge and mass—through defects in the surface oxide film—between the solution and the sub-surface metal.2) In situations like this, changes in surface morphology begin to arise only after the impact of corrosion reactions has accumulated to some extent. For this reason, real-time changes in corroded regions cannot be observed using AFM or STM. This problem poses particularly severe challenges to the characterization of highly corrosion-resistant materials such as stainless steel. This high corrosion resistance ensures that almost no structural variation is discernible over the timescales (on the order of several hours) of typical experiments. In practice, such materials may be characterized by immersing test samples in seawater for several months or longer; however, such studies not only require signifi cant time and effort but are also incapable of yielding in-situ information.
Solving these problems requires techniques for directly observing the local distribution of corrosion cells. In corrosion processes, current fl ows in solution from the anode to the cathode. Consequently, the electric potential of the solution is higher near the anode than near the cathode. However, to date, measurements of the local electric potential distribution in solution have proven diffi cult. Kelvin-probe force microscopy (KFM) in atmosphere or vacuum has been used as a technique for measuring nanoscale electric potential distributions.3) In this method, AC and DC bias voltages (Vaccosωt and Vdc) are applied between the tip and the sample, the resulting induced electrostatic force is detected, and Vdc is adjusted to minimize this force by canceling the tip-sample electric potential difference. By recording Vdc as the tip is scanned in the horizontal direction, one can then measure the distribution of the surface potential Vs. However, in solution the application of a DC voltage induces unwanted electrochemical reactions and reorganization of water and ions, and thus stable operation is not possible in this environment.
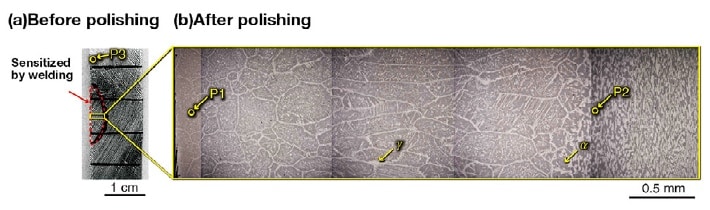
Fig 2. Optical micrographs of the duplex stainless steel samples used in our experiments.7)
(a) A wide-area image taken before polishing. The region indicated by the dashed line has been sensitized by welding.
(b) An enlarged image, taken after polishing, of the region delineated by the rectangle in (a). We performed OL-EPM measurements at the points labeled P1 through P3.
To address these problems, we have developed open-loop electric potential microscopy (OL-EPM) [Figure 1(b)].4-6) In this method, the only voltage applied between the tip and sample is an AC bias voltage with a relatively high frequency ω, thus avoiding the problems described above for KFM in solution. We measure the amplitudes A1 and A2 of the ω and 2ω frequency components of the induced cantilever oscillations and perform a calculation involving these amplitudes to determine the local electric potential distribution.
In this paper we present the results of an application of this technique to measure changes in the nanoscale structure and electric potential distribution of a sample of stainless steel as it corrodes while immersed in electrolytic solution.7) In particular, we consider the relationship between corrosion behavior and the measured electric potential distribution, and we demonstrate that our measurement technique is capable of observing the nanoscale distribution of local corrosion cells. Then we discuss the ways in which information obtained by this technique can be used to understand corrosion mechanisms and characterize corrosion resistance.
Duplex stainless steel consists of a ferrite phase (the α phase) and an austenite phase (the γ phase), with a typical component ratio of approximately 1:1.8) Because this material exhibits extremely high corrosion resistance, it is used as a structural material for large-scale plants that subject to exposure to a harsh corrosion environment. Various types of stainless steel have been developed to optimize corrosion resistance in different environments. Characterization of local corrosion resistance poses a serious challenge in the development process for these materials. The length of time required to induce the changes in surface structure needed to ensure high corrosion resistance in stainless steel frequently extends to several months or longer. Consequently, characterizing corrosion resistance using SEM, STM, or AFM is extremely inefficient or practically impossible in many cases. The development of methods capable of addressing this problem by allowing characterization of local corrosion resistance in short periods of time is thus a highly desirable goal.
In this study, we use OL-EPM measurements to observe the corrosion behavior of a duplex stainless steel (UNS S32750) in an electrolytic solution. This material exhibits high corrosion resistance under a variety of environments, but suffers from greater sensitivity in the vicinity of welding sites, where corrosion resistance is known to deteriorate.8) This welding-induced degradation of corrosion resistance is one of the most severe problems afflicting applications of duplex stainless steel. Here we investigate the corrosion behavior of sensitized stainless steel with nanoscale resolution; our goal is to understand the impact of welding on corrosion.
Figure 2(a) is an optical micrograph of the sample used in these experiments before polishing. The region delineated by the dashed line is the portion sensitized by welding. Figure 2(b) is an enlarged image of the rectangle-delineated region in Figure 2(a) taken after polishing. In these images, the regions of dark and bright contrast correspond respectively to α-phase and γ-phase portions of the sample. We see that welding increases the fraction of the sample consisting of the α phase. We performed OL-EPM observations at three points lying various distances from the welding site (points P1, P2, and P3, indicated by arrows in the figure).
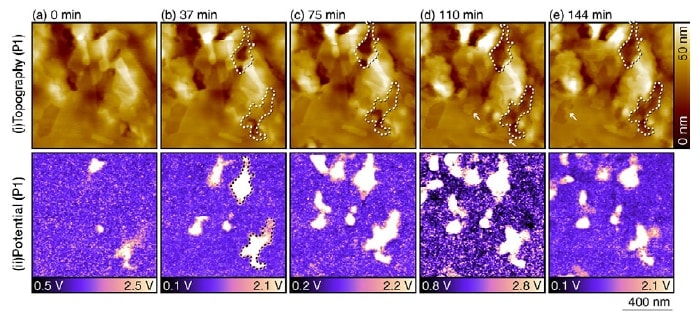
Fig 3. Topographic and potential images for a duplex stainless steel sample in a 10 mM NaCl aqueous solution, acquired after the sensitization processing.7)
These measurements were performed at the position labeled P1 in Figure 2(b) with parameters Vac=1 V, f1=700 kHz, and f2=730 kHz.
The timestamp "0 minutes" corresponds to the time at which measurements at this position were initiated.
The origin of the height scale in the topographic images is chosen arbitrarily.
Figure 3 shows topographic and potential images for a duplex stainless steel sample immersed in a 10 mM aqueous solution of NaCl after the sensitization processing. These measurements were performed at the position labeled P1 in Figure 2(b). The potential images show clearly discernible nanoscale contrast variations. These do not necessarily correspond to contrast variations in the topographic image, demonstrating that the potential image cannot be explained as simply an artifact due to the surface morphology. Comparing the topographic and potential images, it can be seen that regions of high electric potential are selectively dissolved in the solution. As one example, in the potential image taken at 37 minutes [Figure 3(b)] we have drawn a dashed line to indicate a region of high electric potential; this same region is also indicated in the topographic images of Figures 3(b-e). At 37 minutes, the topographic image shows contrast variations that bear little relation to what is seen in the potential image. However, as time passes we see that this region gradually dissolves, and its height falls below that of surrounding regions. The sunken regions in the image at 144 minutes agree well with the high potential regions in the image at 37 minutes, despite the 107-minute interval separating these two images. This fi nding demonstrates that regions with high measured values of the electric potential are selectively corroded.
The surface of stainless steel is typically covered by a chromium oxide fi lm; because this functions as a passivating film, the material exhibits outstanding corrosion resistance. However, subjecting the material to welding produces σ-phase regions and chromium carbides and nitrides in the vicinity of grain boundaries.9) The chromium defi ciency in these regions inhibits the formation of a passivating film, so that these regions function as anodes, giving rise to the following oxidation reaction:
Fe→Fe2++2e- (1)
As a result, the concentration of positive ions in solution near the anode region increases, raising the electric potential of the solution. Meanwhile, all other surface regions function as cathodes, giving rise to the following reduction reactions:
O2+2H2O+4e-→4OH- (2)
2H++2e-→H2 (3)
These reactions serve to increase the concentration of negative ions (or reduce the concentration of positive ions), decreasing the potential of the solution in the vicinity of cathode regions.
Thus, regions of high corrosion activity exhibit higher potential than their surroundings. Because chromium oxide fi lms exhibit very high corrosion resistance, an extreme discrepancy arises between anode and cathode regions. This frequently leads to local formation of deep pits, which is known as pitting corrosion, on the surfaces of stainless steel immersed in electrolytic solutions. This explains why potential images exhibit extremely clear contrast variations.
In addition to dissolution behavior, topographic images also reveal the formation of layered structures with thicknesses of 2-4 nm, as indicated by the arrows in Figures 3(d,e). We interpret them as the products of iron corrosion. In general, iron corrosion reactions produce Fe2+ and OH-, which form Fe(OH)2. These molecules then react with dissolved oxygen in the surrounding solution to form Fe(OH)3, which undergo dehydration reactions to yield oxides such as FeO, Fe3O4, and Fe2O3. These oxides accumulate in layers on the iron surface, forming the deposits commonly known as rust. The deposition and growth of these oxide fi lms is not accompanied by oxidation-reduction reactions. For this reason, potential images reveal no variations associated with these reactions. This suggests that the impact of changes in surface morphology on potential images is so minuscule as to be entirely negligible.
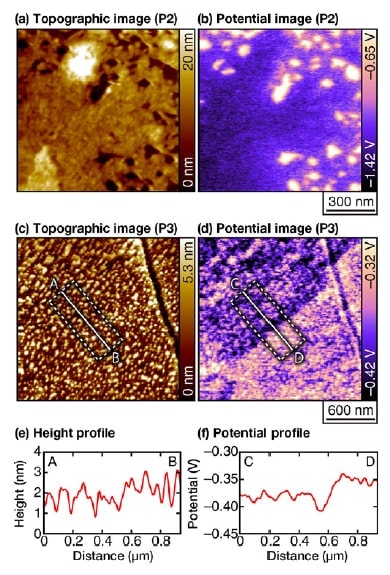
Fig 4. Topographic and potential images for a duplex stainless steel sample in an acidic solution of pH 3, acquired after the sensitization processing.
(Parameters: Vac=0.8 V, f1=700 kHz, f2=730 kHz).7)
The origin of the height scale in the topographic images is chosen arbitrarily.
(a,b) Measurement position: P2. Solution: 1 mM HCl, 1 mM NaCl.
(c,d) Measurement position: P3. Solution: 1 mM HCl.
Based on the fact that we observe numerous layered structures corresponding to rust on the sample surface, we conclude that the regions observed in this experiment are primarily covered by layered oxide films and that the corrosion reactions proceed underneath these layers and beneath the surface. For example, in the topographic images taken between 75 and 110 minutes, the surface structures in the dashed-line region suddenly disappear, leaving the appearance that a sunken region has formed. Nonetheless, the corrosion reactions are in fact gradually proceeding beneath the surface throughout this time, and structures at the outermost surface regions dissolve once the effect of these reactions has accumulated to a certain extent. Indeed, in the potential images we observe visual evidence that such corrosion reactions are proceeding long before any changes have become discernible in the topographic images. This demonstrates a unique advantage of OL-EPM: the ability to detect the progress of corrosion long before its effects become visible in topographic images.
We next exploit this feature to characterize corrosion resistance at points far from the welded regions (Figure 4). Because such regions are highly corrosion-resistant, even in an acidic solution with pH 3 there is essentially no change in morphology over the timescales (on the order of several hours) typical of conventional measurements. At point P2, which lies near the edge of the region subjected to the sensitization process, we observe the formation of nanoscale pits [Figure 4(a)]. However, the width and depth of these pits (approximately 10 nm) remains entirely unchanged over the entire duration (more than 100 minutes) of the measurement. In contrast, from the potential images we see that the electric potential in these pits is higher than in surrounding regions, clearly indicating a high degree of corrosion activity.
The topographic image obtained at point P3, which lies a large distance away from the welded region, shows many small bumps with heights of around 1-3 nm. Once again we observe absolutely no structural variation over the severalhour duration of the experimental measurement at this site; i n contrast, the potential i mage reveals a clear electricpotential difference between the upper-left and lower-right regions of the image. A height profile captured over a line segment straddling these two regions shows a gap of roughly 0.5 nm between the two regions [Figure 4(e)]. Such a height differential is sufficiently large to allow detection with the vertical resolution offered by AFM (approximately 10 pm). However, because the bump-shaped structures are present in such large numbers, it is not necessarily easy to detect this height gap in morphology images. In contrast, the potential image reveals the interface with a high degree of clarity [Figure 4(f)].
Because α-phase grains are mechanically softer than α-phase grains, it is known that α-phase regions lie slightly below α-phase regions after polishing. Thus the upper-left and lower-right regions of the image correspond respectively to α-phase and α-phase regions. Thus, the potential image indicates that α-phase regions near grain boundaries exhibit relatively high corrosion activity. However, the potential difference here is much smaller than that observed in Figures 3 and 4(b). Such potential differences are not present in the vicinity of all grain boundaries; instead, these potential differences only exist locally, which we suspect is a reflection of local variations in component ratios. In the past, characterization of local corrosion activity in stainless steel has been considered a difficult challenge due to the high corrosion resistance of this material. The illustrative measurements we have presented here clearly indicate the potential of OL-EPM to furnish a solution to this problem.
In this paper, we noted that techniques for measuring electric potential distributions in solution are a key requirement for corrosion research, and we introduced OL-EPM as a technique with the ability to solve this problem. We presented results of OL-EPM measurements of nanoscale corrosion behavior in stainless steel, noting the key advantages of the technique. More specifically, we demonstrated that OL-EPM allows direct observation of the nanoscale distribution of local corrosion cells. Regions of high and low electric potentials function as anode-like and cathode-like regions, respectively, and we explained this correspondence in terms of the growth or reduction in the relative concentration of positive ions in solution near anode and cathode regions. The generality of this explanation suggests that the methods described in this paper may also be applicable to the analysis of corrosion behavior in other metallic materials. Indeed, we have applied the techniques described here to analyze corrosion in aluminum alloys and copper interconnects, and we have confirmed that the correspondence described above holds for these samples as well.
Techniques for direct observation of local corrosion cells play two important roles in corrosion research. First, they can reveal the evolution of corrosion sites in real time. Many corrosion reactions proceed under surface oxide films or corrosion products.that is, beneath the surface. For this reason, surface observation methods such as AFM or STM are incapable of capturing the temporal evolution of corrosion sites in real time. In contrast, the electric potential responds instantaneously to corrosion reactions, thus offering information of immediate relevance. Second, techniques for direct observation of local corrosion cells allow characterization of local corrosion resistance in highly corrosion-resistant materials in relatively short times. This can significantly reduce the time and expense required to characterize local corrosion resistance in stainless steel, greatly facilitating efforts to develop highly corrosion-resistant materials.
In the experiments, we exploited these advantages of OL-EPM to obtain important insight into corrosion mechanisms. For example, we obtained the first experimental confirmation that local corrosion cells can exist even in cases where surface morphology remains entirely unchanged. Discoveries like this clearly testify to the usefulness of the methods proposed here for corrosion research. In principle, the ability to visualize the distribution of anode and cathode regions should also be of tremendous utility for studies of oxidation-reduction reactions other than corrosion, including reactions at battery electrodes and catalytic reactions. We hope that the results presented in this paper open the door to these and other applications of OL-EPM in nanoscale electrochemistry research.
References
See more
