
Actual Performance Management and Analysis System CyberBridge

Process data collection and management system, CyberBridge is a system that collects and accumulates the process data, alarm data and logging data of Hitachi total instrumental system EX series and other companies’ control systems and performs result management and analysis. It also plays the role as a basic section (process database) for the application of various solution packages of CyberPlant.
Feature
Outline of functions of CyberBridge
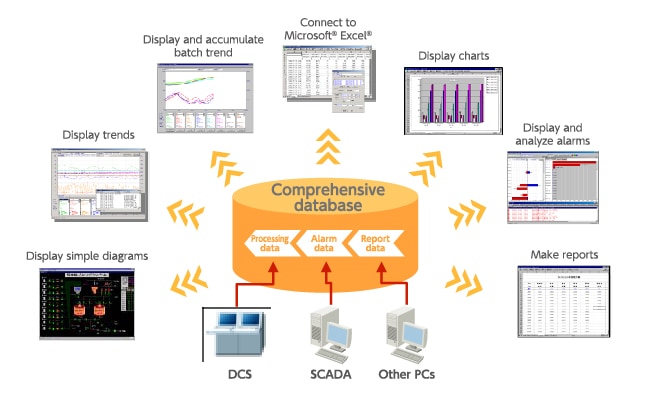
- Can organize long term operation data into the database just by designating process data or logging data to be collected and accumulated.
- The stored data in the process database can be read from Excel to print or analyze. Also has functions to refer to and set the instantaneous data and to display the data trend.
- The system can be constructed using a dedicated screen.
CyberBridge Package
Display trends
Display the trend of accumulated processing data
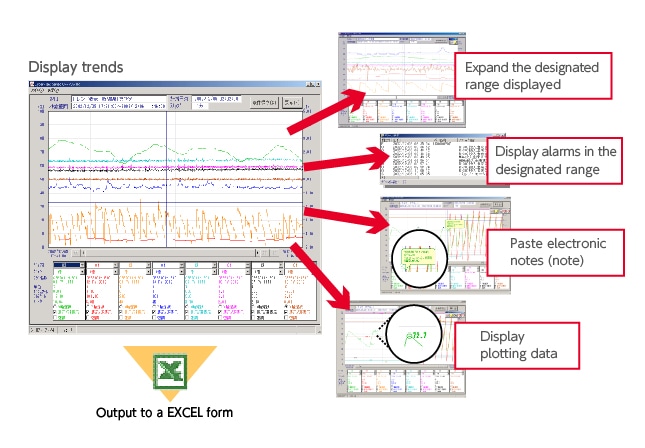
- Trends of advanced functions such as trend enlarging, data, amplification and displaying data at cursor positions
- Display trend-related alarm data
- Image and trend data can easily be pasted into EXCEL
Display and accumulate the batch trend
Applicable for batch plant trend display and analysis
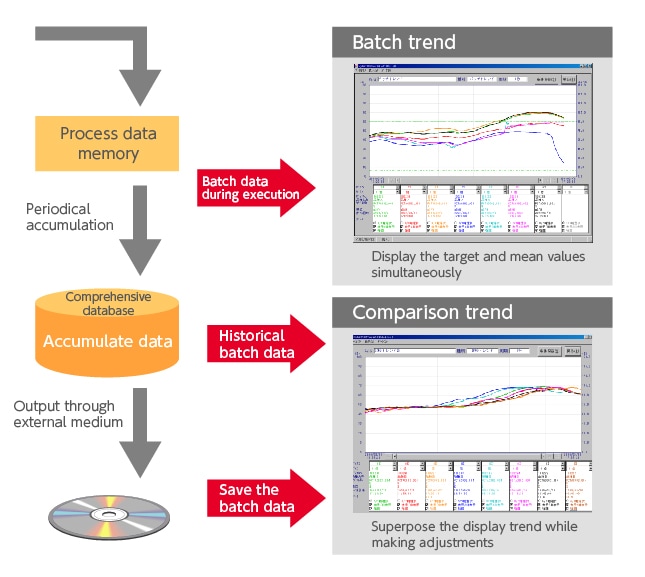
- Acquire processing data and display trend taking a batch as a unit
- Superpose the display trend while adjusting several historical trends simultaneously
- Display the trend of the target and mean values simultaneously
Display and analyze alarms
Display and analyze alarm data on a multi-level basis
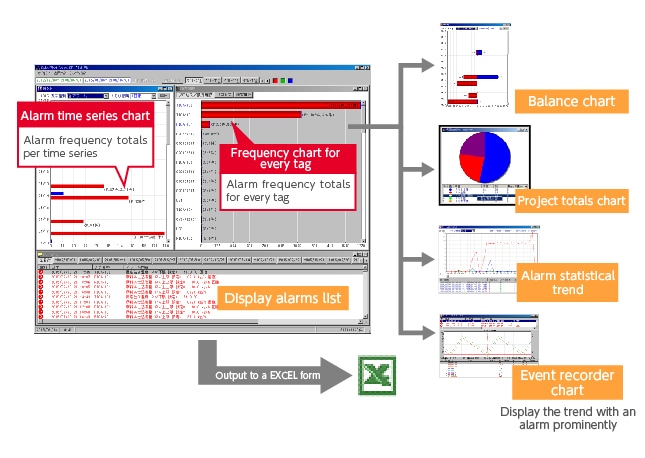
- Display processing and operate guide and verify alarm information already set
- Display and analyze alarms on a multi-level basis in charts such as time series, balance chart and statistics
- Paste alarm data to EXCEL
Make reports
Make simple reports and output daily and batch reports
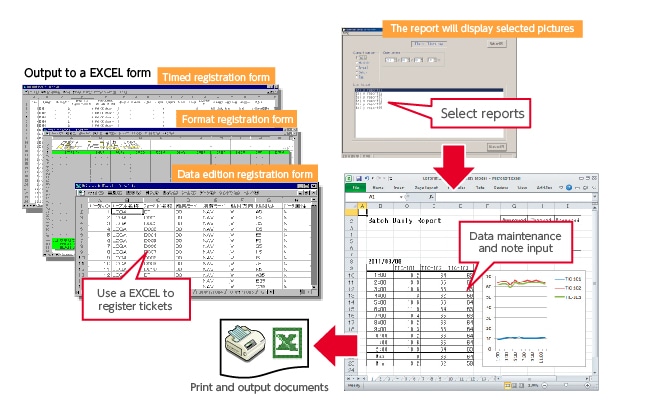
- Use EXCEL to make simple reports
- Print and output files by deadline and event
- Input notes and maintenance data
- Paste ticket data to EXCEL
Connect it to EXCEL
Directly output processing data to EXCEL
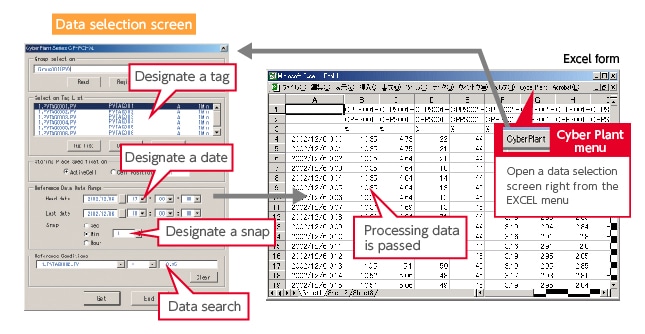
- Connected directly to the EXCEL menu
- Data can easily be pasted into EXCEL
- Rich search functions such as date range and snap
Display simple charts
Intuitively monitor processing with chart display
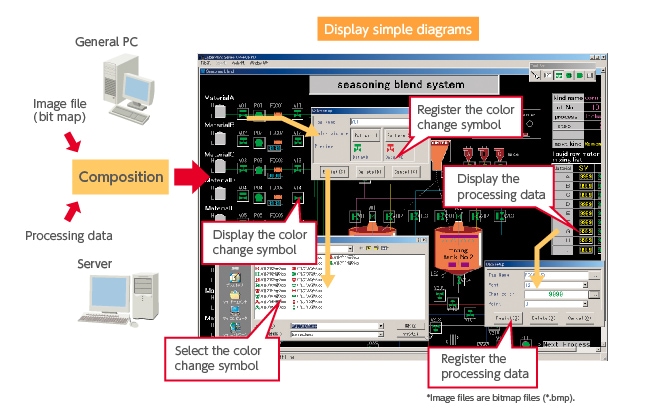
* Image files are bitmap files (*.bmp).
- Monitor the processing state at an office separated from the apparatus room
- Use software to construct a monitoring screen through created image files
- Paste the monitoring screen to EXCEL