


Battery Materials Analysis Workflows for R&D and Failure Investigation
Provided by Environmental Business Division | Published: November 11, 2026
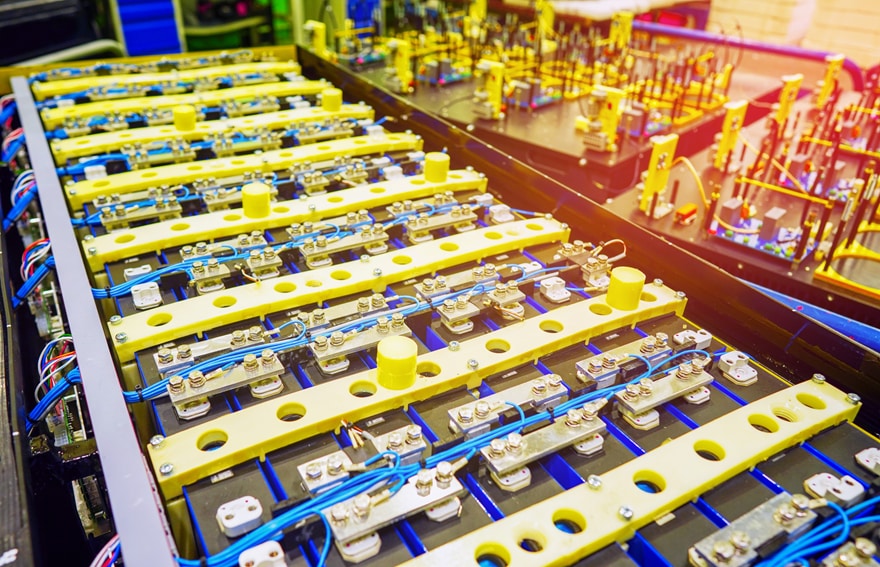
Particle size, coating uniformity, and interface chemistry shape how a lithium-ion cell charges, ages, and fails. Battery materials analysis connects those microscale details to real-world performance. It helps R&D teams refine designs and gives failure analysts a clear path to root cause.
A well-built workflow matters as much as any single instrument. Battery materials are reactive, layered, and easy to damage during handling. The right sequence of preparation, imaging, and chemical mapping turns raw samples into reliable answers. This guide walks through how labs can structure that workflow for both development and failure investigation.
Why Battery Materials Analysis Matters From R&D to Failure Investigation
Battery performance starts with structure. Cathode-particle morphology affects capacity and rate capability. Electrode porosity controls how ions move through the cell. Even small coating defects can trigger early degradation.
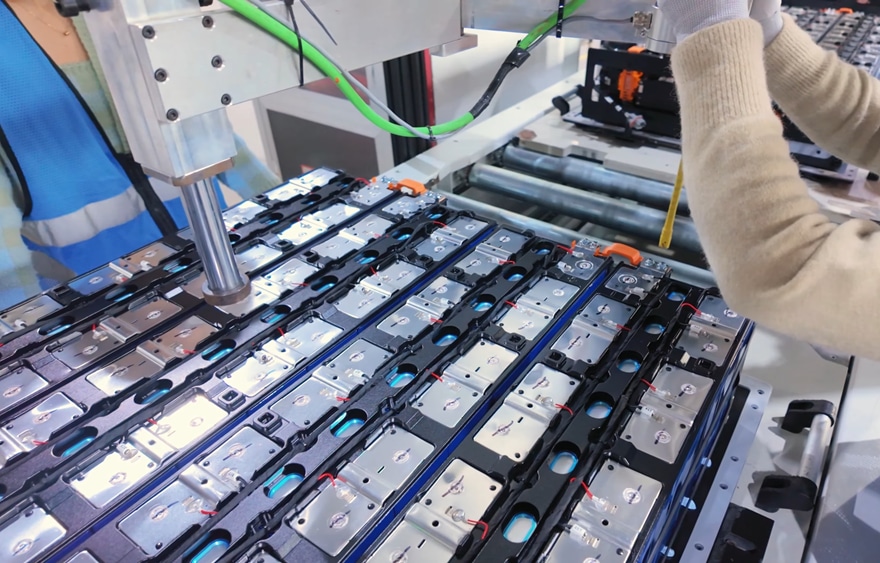
In R&D, analysis guides material selection and process tuning. Teams compare synthesis routes, binder systems, and calendering conditions, and they need consistent data to see which change made the difference. Hitachi High-Tech America describes how electron microscopy helps bridge the gap from lab to production in battery development.
Failure investigation asks a different question. Something has already gone wrong, and the goal is to understand why. Analysts trace symptoms like capacity fade or internal shorts back to physical evidence. The same microscopy tools serve both goals, but the workflow priorities shift.
Building a Battery Materials Analysis Workflow Step by Step
A reliable workflow follows a logical sequence. Each stage protects the integrity of the next one. Skipping a step often means repeating the whole analysis.
- Sample handling and transfer. Lithium metal, charged anodes, and many electrolytes react quickly with air and moisture. Samples should move from the glove box to the instrument without atmospheric exposure.
- Cross-section preparation. Mechanical cutting can smear soft layers and crack brittle particles. Broad ion beam cross-section milling produces clean, flat surfaces that reveal true internal structure. Cooling during milling helps protect heat-sensitive materials.
- Morphology imaging. Secondary electron imaging shows particle shape, cracks, and surface films. Backscattered electron imaging adds compositional contrast between phases.
- Elemental mapping. Energy-dispersive X-ray spectroscopy (EDS) maps elements across the cross-section. It reveals coating coverage, transition metal migration, and unexpected contaminants.
- Quantification and reporting. Image analysis turns micrographs into numbers. Particle size, porosity, and layer thickness data support solid statistical comparisons.
Consistency across these steps is what makes battery materials analysis repeatable from one batch to the next.
Common Failure Modes and What Microscopy Reveals
Failure analysis works best when it starts with a clear hypothesis. Cycling history, electrical test data, and teardown notes point toward likely causes. Microscopy then confirms or rules out each one.
- Particle cracking. Repeated expansion and contraction fractures cathode secondary particles. Cross sections show crack networks and lost particle contact.
- Lithium plating and dendrites. Fast charging or low temperatures can deposit metallic lithium on the anode. These deposits may pierce the separator and cause internal shorts.
- Interphase growth. Thick solid electrolyte interphase (SEI) layers consume active lithium. They also raise cell resistance over time.
- Metallic contamination. Foreign particles from equipment wear or raw materials can create short circuits. Copper, iron, and stainless steel fragments are common culprits.
- Delamination. Poor adhesion between the coating and current collector increases resistance. It often appears as gaps at the electrode interface.
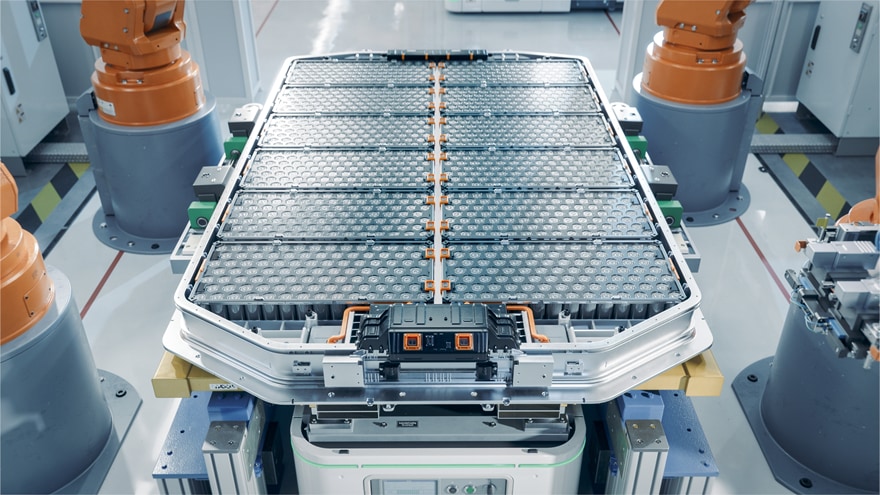
Contamination deserves special attention in production, since a single conductive particle can compromise a cell. Automated SEM-EDS particle analysis can scan large filter areas and sort particles by size and chemistry, which supports faster root-cause decisions.
How Hitachi Supports Battery R&D and Failure Analysis
Hitachi High-Tech offers instruments and software for each stage of this workflow. Its application specialists also work closely with customers to tailor each setup.
The SU3800SE and SU3900SE are Schottky field-emission SEMs built for high-resolution imaging and analysis. The SU3900SE accepts specimens up to 300 mm in diameter and 130 mm in height. That capacity suits large electrode sheets and battery components. Automatic optical adjustment reduces setup time. Optional EM Flow Creator software automates routine imaging recipes without coding.
For a compact and versatile option, the FlexSEM 1000 II fits easily into busy labs. Its low-vacuum mode images insulating separators and binders without metal coating. SEM MAP links an optical camera image to the SEM view for quick navigation.
For preparation, the IM4000II ion milling system offers an Air Protection Holder Unit that moves battery samples to the SEM without air exposure. The ArBlade 5000 adds cross sections up to 8 mm wide and cryogenic versions for heat-sensitive materials.
AMICS software automates large-area mapping and EDS-based classification. It runs on a variety of Hitachi SEM and FE-SEM systems and can assist in classifying difficult phases.
Take the Next Step Toward Clearer Battery Insights
Whether you are screening new cathode chemistries or tracing a field failure, we can recommend instruments, preparation methods, and automation options that fit your materials and goals. Contact our team to start building a battery materials analysis workflow for your lab.