
Efforts to Conserve Water Resources
Basic Approach
The Hitachi High-Tech Group aims to achieve nature positive by improving water use efficiency by more than 10% compared to the base year by fiscal 2030 through initiatives such as the circulation and reuse of cooling water and investment in water-saving equipment. We are also working to minimize water risks in our business activities.
Independent Assurance
In order to enhance the credibility of this report, FY2024 figures marked with ![]() mark icon have received independent assurance from SOCOTEC Certification Japan Co., Ltd. in accordance with the International Standard on Assurance Engagements (ISAE) 3000 and ISO14064-3.
mark icon have received independent assurance from SOCOTEC Certification Japan Co., Ltd. in accordance with the International Standard on Assurance Engagements (ISAE) 3000 and ISO14064-3.
Initiatives
Effective Utilization of Water Resources
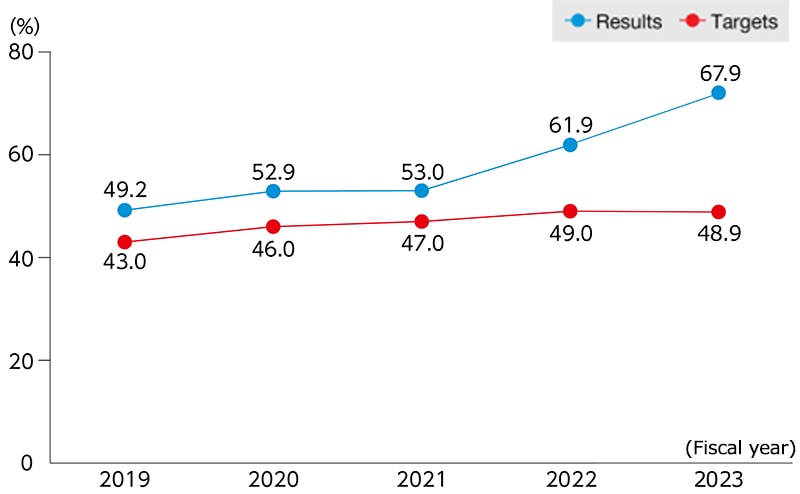
Our Group is working to utilize water effectively. These measures include reducing the volume of water used through initiatives including productivity improvements and upgrading to water-conserving equipment. We pursued activities in FY2024 with a target for reduction in water use per unit of 61.8% (base FY2010) and achieved 67.4%. Hitachi High-Tech also performs global water stress assessments every year, as well as water risk assessments at all sites in Japan. None of our business sites indicate high stress or high risk. Going forward, however, we will continue working to avoid risks at sites where risk reduction is possible.
Addressing Water Risk
Hitachi High-Tech Group checks water risk four times a year for sites in Japan and once a year for sites outside Japan using its own checklist, Water Risk Assessment Sheet. We also use WRI Aqueduct's water stress map tool to list and understand the water stress levels at our locations. When the water stress level reaches the highest level of 5, it is defined as a "highly water-stressed site.” Furthermore, the Hitachi High-Tech Group requires all suppliers to collaborate on water risk countermeasures using the Hitachi Group's Sustainable Procurement Guidelines. Specifically, these guidelines include supplier compliance items and a code of conduct regarding suppliers’ own water use reduction and water quality conservation. In fiscal 2024, our group undertook its first-ever TNFD assessment and disclosed related information.
Performance Data
Water Resource Reduction Targets and Results
Our group is working to improve water use efficiency at domestic manufacturing, sales, and service sites, and in particular, at seven domestic manufacturing sites with high water usage, we are investing in facilities such as circulating water systems and water-saving toilets.
Changes in Volume of Water Consumption in Japan – Improvement Rate per Unit
* Reporting boundary: Hitachi High-Tech (excluding branches), group manufacturing companies (excluding Tokyo Solution Laboratory), and service companies in Japan
* Energy usage improvement rate per unit: The rate of improvement over the base {(1 - base units of the relevant site for the relevant fiscal year/base units of the relevant site for the base year) × environmental impact at the relevant site for the base year calculated by group companies in Japan}
Changes in Water Withdrawals in Japan 
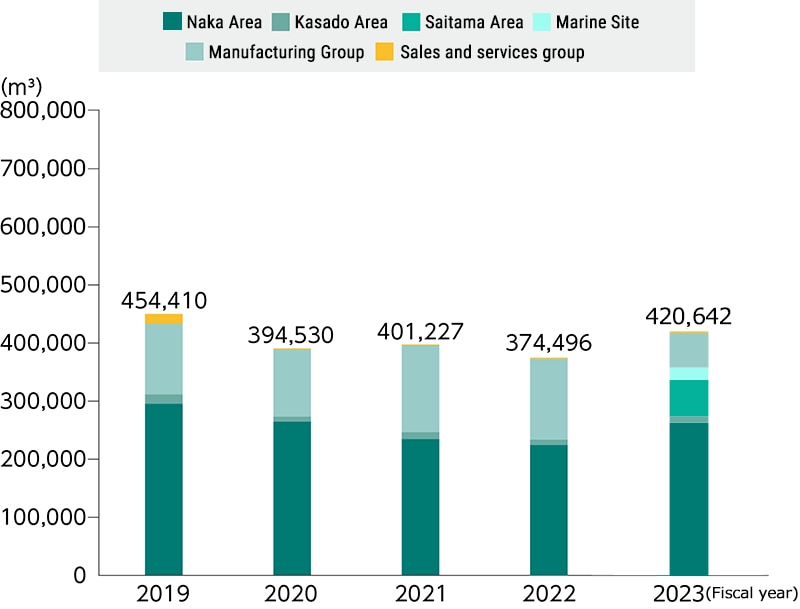
* Reporting boundary: Manufacturing sites of Hitachi High-Tech, Group manufacturing companies in Japan, and sales-related and service-related companies in Japan
Water Withdrawals in Japan by Source
(m3)
| Source | FY2020 | FY2021 | FY2022 | FY2023 | FY2024 |
|---|---|---|---|---|---|
| Waterworks Bureau for portable water | 34,670 | 54,946 | 64,720 | 88,054 | 93,849 |
| Waterworks Bureau for industrial water | 269,990 | 244,521 | 229,884 | 248,611 | 284,994 |
| Groundwater | 89,870 | 101,760 | 79,892 | 83,976 | 84,530 |
| Seawater | 0 | 0 | 0 | 0 | 0 |
| Total | 394,530 | 401,227 | 374,496 | 420,642 | 465,919 |
*
Reporting boundary:
Head Office Area, Naka Area, Kasado Area, Saitama Area, Hitachi High-Tech Manufacturing & Service (Minami Site, Naka-Nishi Site), Hitachi High-Tech Science Fuji Oyama Works (former Oyama Works), Hitachi High-Tech Solutions Mito, Hitachi High-Tech Kyushu, Hitachi High-Tech Fielding
* The Hitachi High-Tech Science Oyama Works changed its name to Fuji Oyama Works in February 2020.
Water Discharge Volume in Japan by Destination
(m3)
| Destination | FY2020 | FY2021 | FY2022 | FY2023 | FY2024 |
|---|---|---|---|---|---|
| Off-site water treatment | 112,964 | 137,143 | 132,578 | 146,043 | 158,605 |
| Rivers | 216,226 | 220,919 | 179,195 | 201,780 | 217,464 |
| Ocean | 8,749 | 12,097 | 9,252 | 10,783 | 11,923 |
| Product content (consumption) |
347 | 406 | 368 | 367 | 349 |
| Other (consumption) | 56,244 | 30,662 | 53,103 | 61,669 | 77,578 |
| Total | 394,530 | 401,227 | 374,496 | 420,642 | 465,919 |
*
Reporting boundary:
Head Office Area, Naka Area, Kasado Area, Saitama Area, Hitachi High-Tech Manufacturing & Service (Minami Site, Naka-Nishi Site), Hitachi High-Tech Science Fuji Oyama Works (former Oyama Works), Hitachi High-Tech Solutions Mito, Hitachi High-Tech Kyushu, Hitachi High-Tech Fielding
* From FY2018, water consumption for drinking, fire-fighting, water infiltration, etc. has been included in “Other (consumption).”
* The Hitachi High-Tech Science Oyama Works changed its name to Fuji Oyama Works in February 2020.
Changes in Water Withdrawals (Outside Japan)
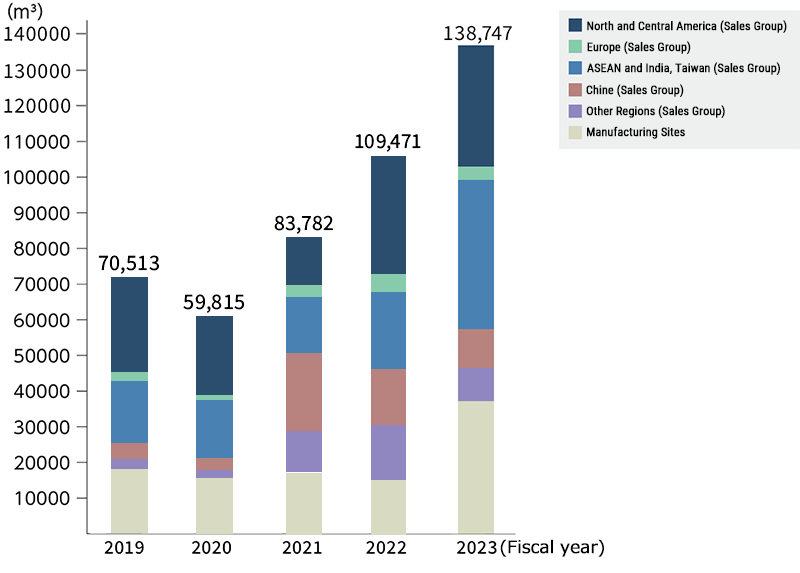
* Reporting boundary: Overseas subsidiaries
* From FY2017, water withdrawals at sales sites where water withdrawals cannot be ascertained is being estimated from numbers of employees and water consumption at sales sites where water withdrawals has been ascertained.
* The number of sites in FY2023 increased from 76 locations in FY2022 to 79 locations.
* Some of sites in China (Sales Group) from FY2019 to FY2022 were changed to manufacturing sites.
Water Withdrawals Outside Japan by Supply Source
(m3)
| Supply source | FY2020 | FY2021 | FY2022 | FY2023 | FY2024 |
|---|---|---|---|---|---|
| Waterworks Bureau | 59,526 | 79,437 | 93,330 | 138,281 | 127,313 |
| Industrial water | 0 | 1,354 | 11,174 | 0 | 1,005 |
| Groundwater | 289 | 1,316 | 1,830 | 166 | 142 |
| Recycled water | 0 | 1,675 | 1,999 | 300 | 310 |
| Total | 59,815 | 83,782 | 108,333 | 138,747 | 128,770 |
Water Effluents Discharged Outside Japan by Discharge Destination
(m3)
| Discharge destination | FY2020 | FY2021 | FY2022 | FY2023 | FY2024 |
|---|---|---|---|---|---|
| Off-site water treatment | 43,704 | 76,350 | 94,456 | 115,445 | 79,699 |
| Rivers | 754 | 690 | 498 | 160 | 32,308 |
| Seawater | 0 | 612 | 0 | 0 | 0 |
| Underground infiltration | 36 | 429 | 3,212 | 261 | 729 |
| Consumption | 15,321 | 5,701 | 10,167 | 22,881 | 16,034 |
| Total | 59,815 | 83,782 | 108,333 | 138,747 | 128,770 |
* Discrepancies arise due to the involvement of figures after the decimal point.
Supplier Risk Management at Manufacturing Sites
At the Naka Works and Kasado Works, the Group’s domestic manufacturing sites, in the operation of our environmental management system, each year we use indirect impact assessment tables to confirm the status of water management by suppliers with high dependency ratios and assess environmental impacts. These assessments are performed once each year, and we assess suppliers in accordance with the assessment criteria for each assessment item. The assessment items are environment-related energy usage, water usage, and status of legal compliance. For the water-related items, we check the volume and types of water intake, where wastewater is released, and legal regulatory systems. In addition, we conduct water risk surveys of the areas where suppliers are located using water stress maps from WRI Aqueduct. We conduct on-site checks for those suppliers identified as having large environmental impact based on the results of the assessments and request improvements as necessary.
CDP*Evaluation
At Hitachi High-Tech Group, we have been responding to the CDP Water Security Questionnaire. In FY2024, we received the highest score of "Leadership: A," for “best practices in managing environmental issues” with our business. In addition to continuing water risk management (tracking) in our Group, we will draw up measures and responses to address risks and will make every effort to enhance corporate value.
* CDP: A UK-based independent non-profit organization. It receives requests from investors around the world, and investigates, evaluates, and discloses information relating to climate change, water security, and forests.