
Greenhouse Gas / Materials Balance
Greenhouse Gas
The Hitachi High-Tech Group is working on reducing greenhouse gas value chain emissions, including greenhouse gas emissions at its business sites (Scope 1 and 2) and greenhouse gas emissions elsewhere (Scope 3), as a response to the risks of climate change.
Independent Assurance
In order to enhance the credibility of this report, FY2024 figures marked with ![]() have received independent assurance from SOCOTEC Certification Japan Co., Ltd. in accordance with the International Standard on Assurance Engagements (ISAE) 3000 and ISO14064-3.
have received independent assurance from SOCOTEC Certification Japan Co., Ltd. in accordance with the International Standard on Assurance Engagements (ISAE) 3000 and ISO14064-3.
Greenhouse Gas Emissions Across the Value Chain
| Scope | Category | Emissions(t-CO2)*1 | ||
|---|---|---|---|---|
| FY2022 results | FY2023 results | FY2024 results | ||
| Scope1 *2 *5 | ― | 7,306 | 6,475 | 6,892 |
| Scope2 *3 *5
Market base |
― | 34,802 < 51,981 > |
33,861 < 62,152 > |
27,587 < 64,337 > |
| Scope3 *4 *6 | 1.Purchased goods and services*7 | 1,077,869 | 1,086,796 | 1,184,289 |
| 2.Capital goods | 59,811 | 105,149 | 80,603 |
|
| 3.Fuel and energy not included in Scopes 1 and 2 | 8,704 | 10,170 | 10,730 |
|
| 4.Upstream transportation and distribution | 10,193 | 6,939 | 8,161 |
|
| 5.Waste generated by business activities | 804 | 904 | 1,359 |
|
| 6.Business travel | 1,314 | 1,525 | 1,649 |
|
| 7.Employee commuting | 5,224 | 5,890 | 7,131 |
|
| 8.Upstream leased assets | (Included in Scope 1,2) | (Included in Scope 1,2) | (Included in Scope 1,2) | |
| 9.Downstream transportation and distribution*8 | 29,717 | 56,382 | 77,311 |
|
| 10.Processing of sold products | (Not applicable) | (Not applicable) | (Not applicable) | |
| 11.Use of sold products | 807,817 | 689,517 | 632,093 |
|
| 12.Disposal of sold products | 8,855 | 12,164 | 7,551 |
|
| 13.Downstream leased assets | (Included in No. 11) | (Included in No. 11) | (Included in No. 11) | |
| 14.Franchises | (Not applicable) | (Not applicable) | (Not applicable) | |
| 15.Investments | (Not applicable) | (Not applicable) | (Not applicable) | |
| Scope 3 Total | 2,010,308 | 1,975,437 | 2,010,878 |
|
| Scope1+ Scope2 Total | 42,108 < 59,287 > |
40,336 < 68,627 > |
34,479 < 71,230 > |
|
| Scope1 + Scope2 + Scope3 Total | 2,052,330 < 2,069,569 > |
2,015,773 < 2,044,063 > |
2,045,357 < 2,082,108 > |
|
*1Due to the number of displayed digits, the total individual values and those for each line may differ in some cases.
*2Direct emissions of greenhouse gases from the organization itself. Includes greenhouse gases from non-energy sources.
*3Indirect emissions due to the use of electricity and heat supplied by other companies. Number in <> is by location basis.
*4Indirect emissions not included in Scopes 1 and 2.
*5Reporting boundary for Scopes 1 and 2 emissions: Hitachi High-Tech Group companies (excluding two overseas subsidiaries)
*6
Reporting boundary for Scope 3 emissions: Hitachi High-Tech, Hitachi High-Tech Group companies in Japan, and manufacturing group companies outside Japan.
However, the scope of coverage for the following categories is as follows:
- Category 1: Excluding Hitachi High-Tech’s head office, sales group companies, and service group companies.
- Category 3: All sites worldwide excluding Hitachi High-Tech Ireland and Hitachi High-Tech Israel.
*7The Category 1 calculation method changed from FY2021.
*8Category 9 is calculated from FY2021.
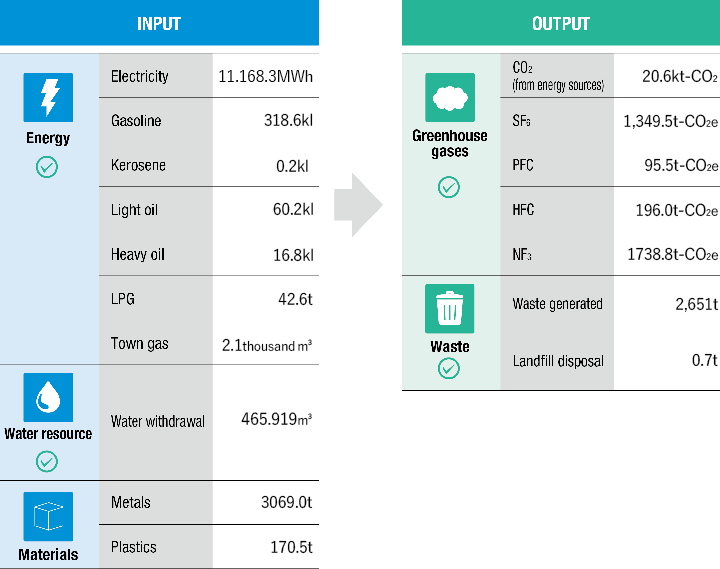
Materials Balance
The following information shows the quantity of resource inputs into the business activities of our Group and the scale of emissions that impose a burden on the environment.
Quantity of Resource Inputs and Emissions That Impose a Burden on the Environment
*
The reporting boundary is the following Hitachi High-Tech and group companies in Japan, excluding certain sites that reside within other Hitachi group's business sites.
Energy and greenhouse gases: Hitachi High-Tech, group manufacturing companies, group sales companies, and group service companies
Water resource: Hitachi High-Tech (manufacturing sites), group manufacturing companies, and group service companies
Waste: Hitachi High-Tech (head office, manufacturing sites), manufacturing group companies, and service group companies
* Raw material inputs include raw materials only and do not include components, semi-finished goods, or finished products purchased from external parties.
* There are no emissions of non-energy –derived CO2, CH4 and N2O specified in the Act on Promotion of Global Warming Countermeasures.
Quantity of Raw Material Inputs (only metals)
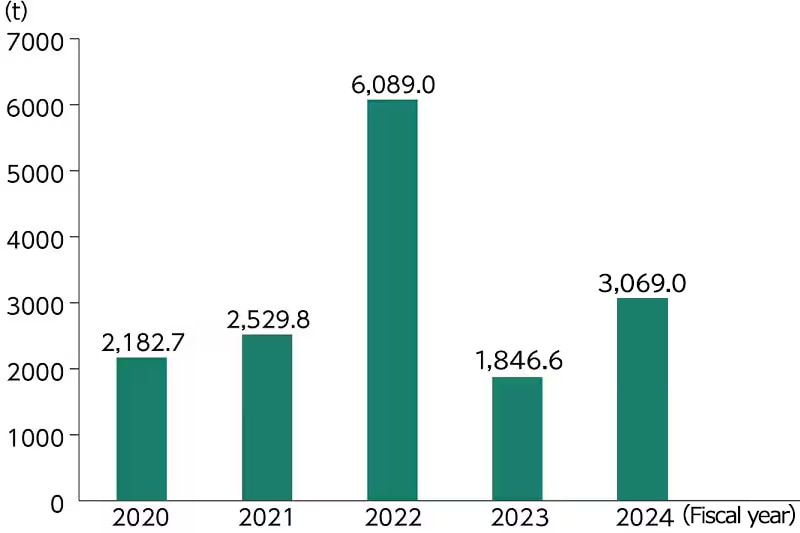
* Reporting boundary: Manufacturing sites of the Hitachi High-Tech and group manufacturing companies in Japan
Breakdown of Raw Material Inputs
(t)
| Material | FY2020 | FY2021 | FY2022 | FY2023 | FY2024 |
|---|---|---|---|---|---|
| Iron (including steel plate) | 399.8 | 421 | 436.00 | 446.3 | 985.7 |
| Stainless steel | 562.0 | 546.6 | 1,886.00 | 341.4 | 568.0 |
| Aluminium | 1,135.4 | 1,434.6 | 2,886.00 | 594.4 | 979.8 |
| Copper | 85.5 | 127.6 | 881.00 | 464.5 | 535.5 |
| Lead | 0.0 | 0.0 | 0.0 | 0.0 | 0.0 |
| Total | 2,182.7 | 2,529.8 | 6,089.00 | 1,846.6 | 3,069.0 |