


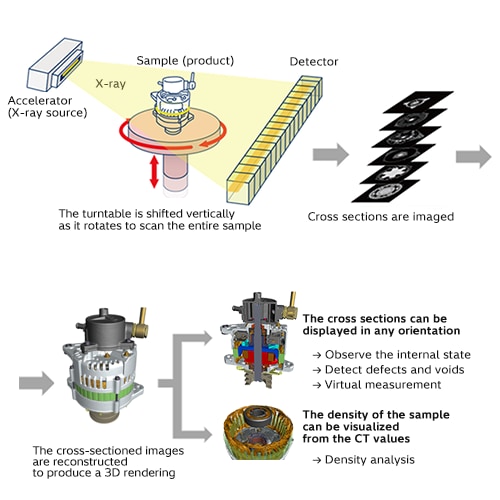
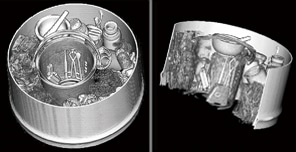
 Three-dimensional images
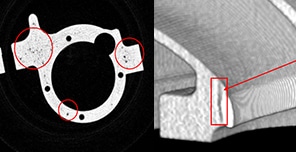 Void analysis of a cast product
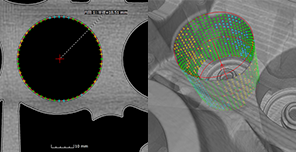 3D coordinate measurement
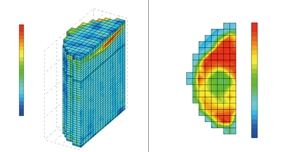 Distribution of cross-sectional mean density variation


This graph shows the differences in penetrability achieved at 450kV, 1MV and 9MV output levels for various materials. Penetrability is determined by the material through which the X-rays pass, the energy of the X-rays, and the dynamic range of the detector. The higher the density of the X-rayed material (higher densities are shown at higher points on the graph), the more difficult it is for X-rays to pass through. When a sample whose length is higher than this penetrability is imaged, streak artifacts are produced.
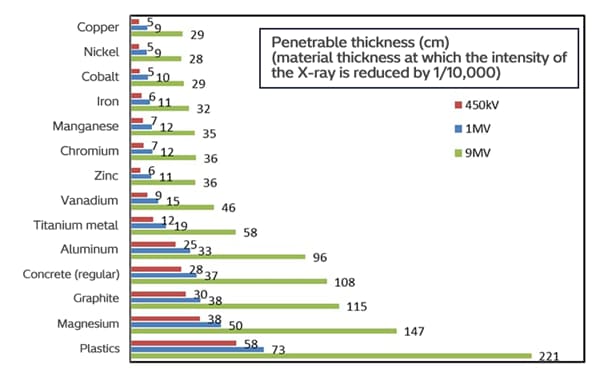
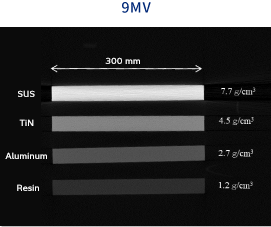
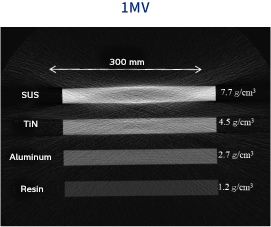
The above diagrams show examples of images of different material samples with a length of 300 mm at different X-ray energy levels. For X-ray energy of 9 MV, a SUS steel sample can be sufficiently penetrated without producing artifacts. However, at 1 MV, the penetrability is insufficient for SUS steel and TiN samples, resulting in streak artifacts.