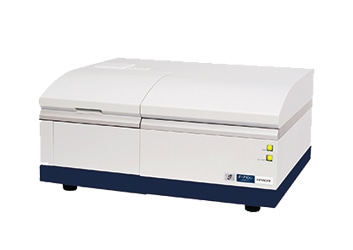
EEM® View -CMOS camera imaging system for Fluorescence Spectrophotometer-
EEM View is a completely new concept system in the world which delivers fluorescence, reflection spectra and these images simultaneously. To make it possible, AI technology is applied to analyze data with a special algorithm*1. This measurement is possible by installing the EEM View Accessory on the F-7000 / 7100 Fluorescent Spectrophotometer.
*1 The spectral analysis algorithm was developed in joint research by Professor Imari SATO and Associate Professor Yinqiang ZHENG of the National Institute of Informatics.
* "EEM" is a trademark of Hitachi High-Tech Analysis Corporation, registered in Japan and China.
Features
What is EEM view?
New technology capable of capturing fluorescence and reflection images and spectra of a sample simultaneously.
- Measurement of spectrum data for samples (spectral and fluorescence properties).
-
Captures images under white light or monochromatic light
(area: Φ20 mm, wavelength range: 380 to 700 nm) - Displays separated fluorescence and reflection images obtained using an analysis algorithm that applies AI technology*1
-
Displays spectra for each partition in an image*1
(fluorescence spectrum and reflection spectrum)
*1 The spectral analysis algorithm was developed in joint research by Professor Imari SATO nd Associate Professor Yinqiang ZHENG of the National Institute of Informatics.
Overview
- Fluorescence Spectrophotometer equipped with CMOS camera imaging system -
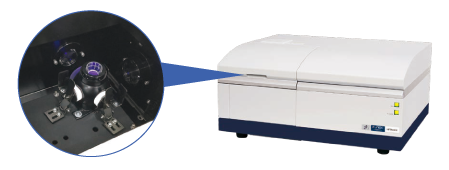
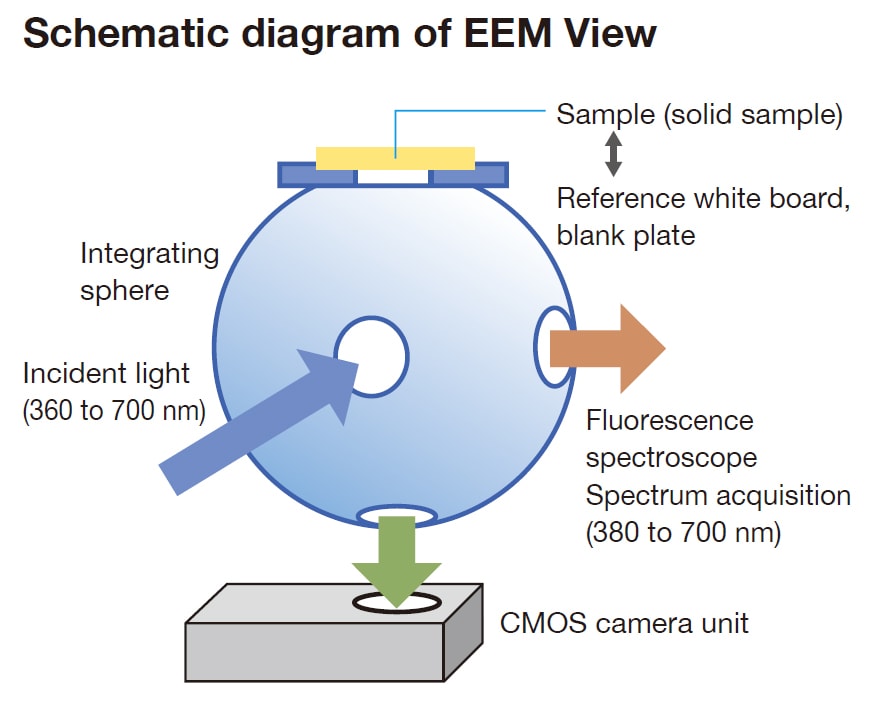
Uniform illumination system using an integrating sphere
Captures fluorescence and reflection images and spectra of samples simultaneously!
- Diffusion of illumination using integrating sphere
- Highly uniform illumination of samples
- Dual detection using fluorescence spectroscope and CMOS camera
A spectrofluorometric microscope is an option that can be attached to the sample chamber of the existing Model F-7100 fluorescence spectrophotometer equipped with CMOS camera.
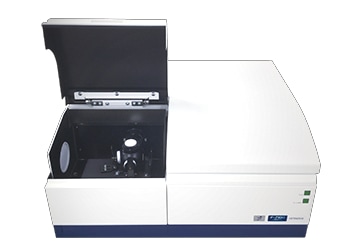
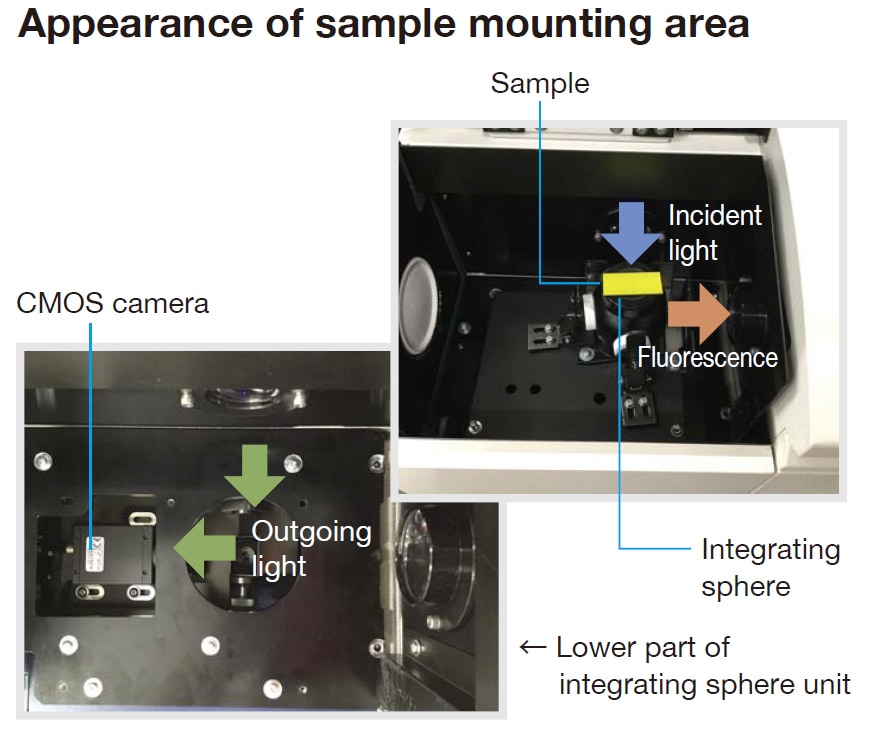
Simple mounting which supports many types of samples!
Simple mounting means just placing the sample on top of the integrating sphere!
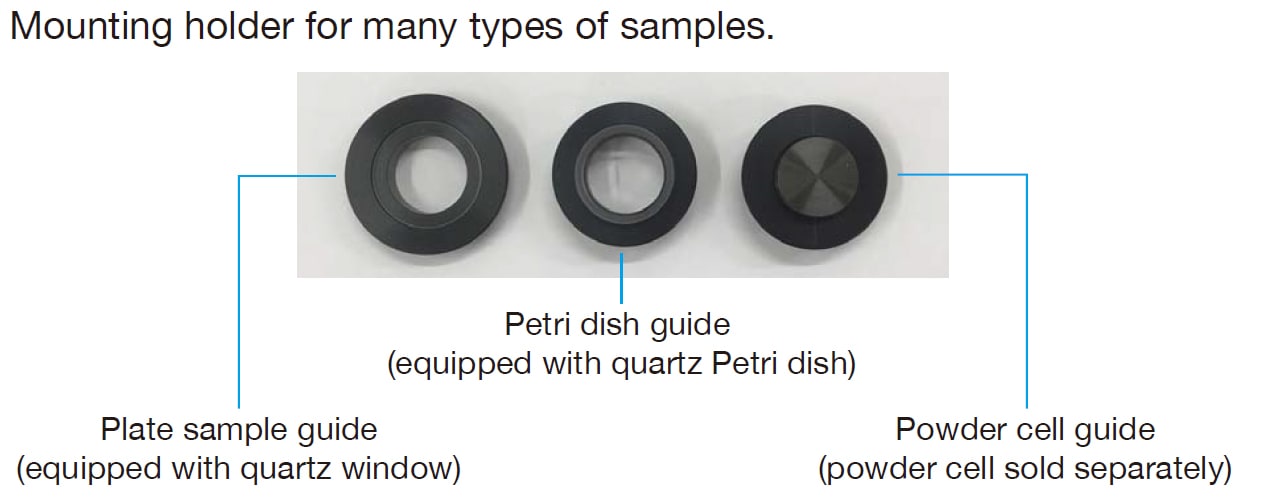
- Plate sample: Mount sample using the quartz window
- Powder sample: Fill the powder sample Petri dish with powder, and mount the sample. In addition, the powder cell included with the separate optional solid sample holder can be used.
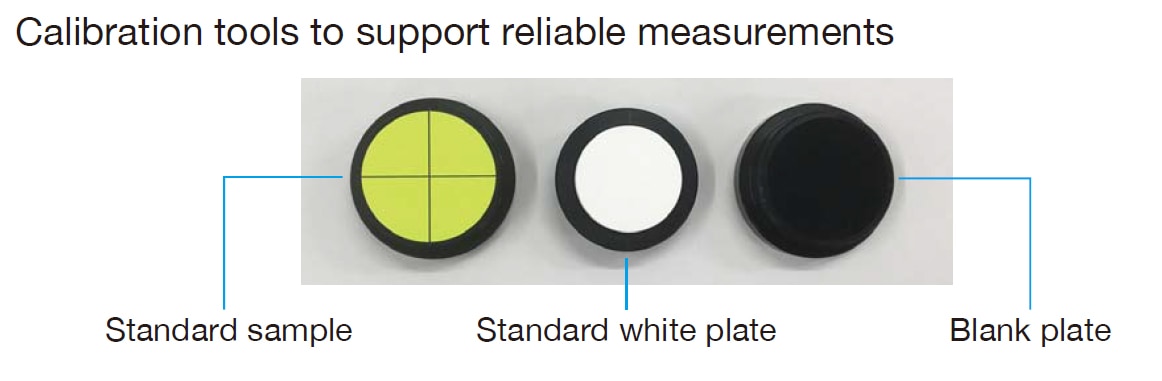
- A fluorescence standard sample is included for alignment confirmation.
- The included reference white plate (100%) and blank plate (0%) are used to carry out calibration. These are used to calibrate the fluorescence intensity and the reflectance, and to correct the in-plane brightness distribution in the image.
Applications
Fluorescence properties and morphology of microstructured material
A fluorescent reflective sheet with a microstructure to improve its visibility was measured.
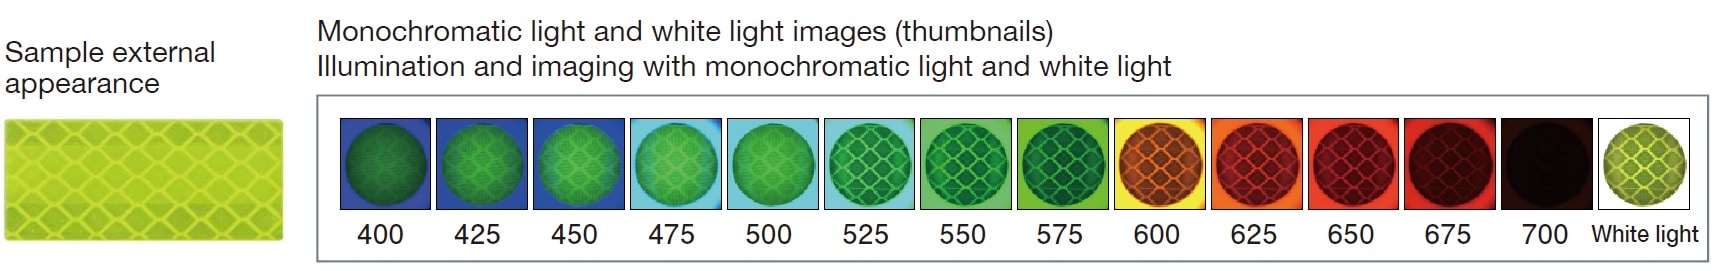
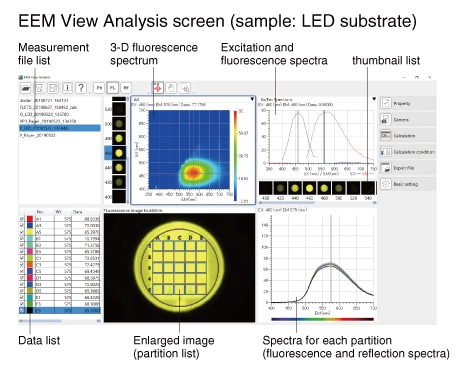
Simultaneous capture of spectrum data and image
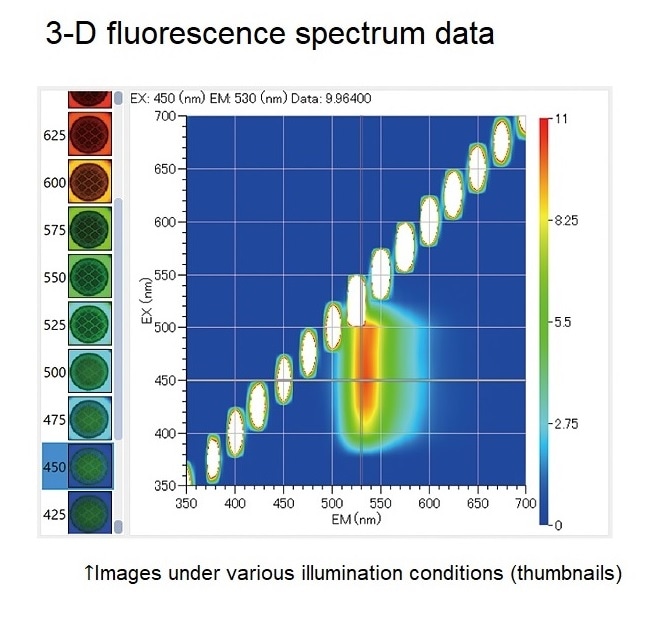
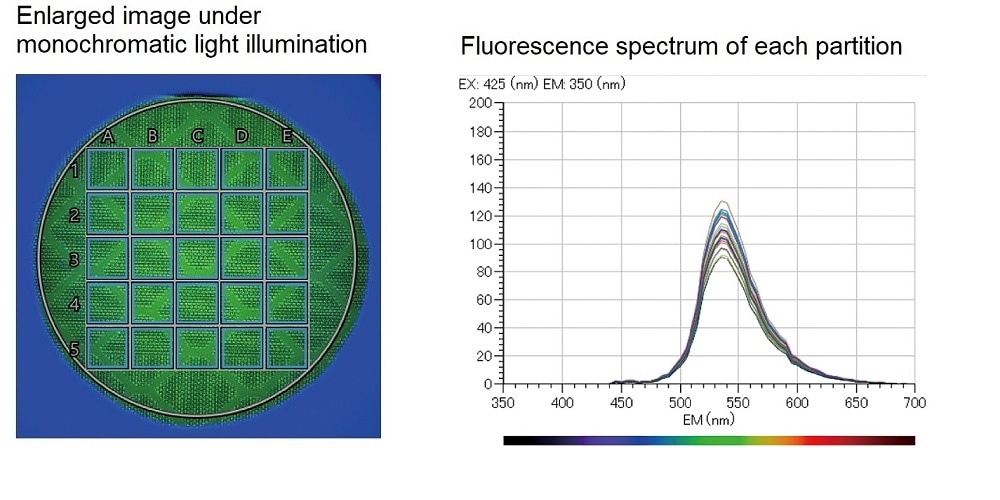
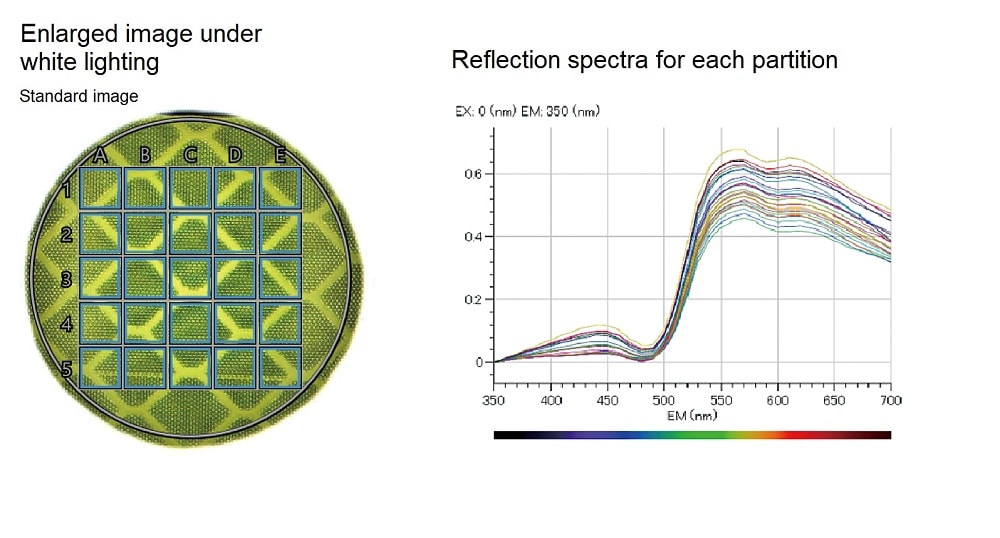
The sample is illuminated with monochromatic light at wavelengths of 360 to 700 nm and with white light. An image is captured under each illumination condition, and the fluorescence spectrum is simultaneously acquired by the fluorescence-side spectroscope. After measurement, the 3-D fluorescence spectra are displayed (excitation wavelength, fluorescence wavelength, and fluorescence intensity). An enlarged image and fluorescence and reflection spectra for each partition can be displayed using the dedicated analysis software. The reflection and fluorescence distribution of samples with in-plane nonuniformity can be captured as images and spectra.
Spectral calculation and display of each partition (fluorescence and reflection)
Separated image display (fluorescence and reflection)
Separation of a captured image into a reflected light image and a fluorescence image
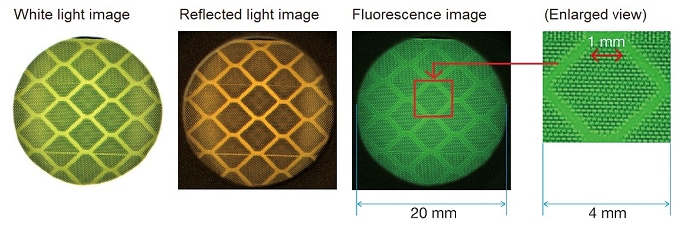
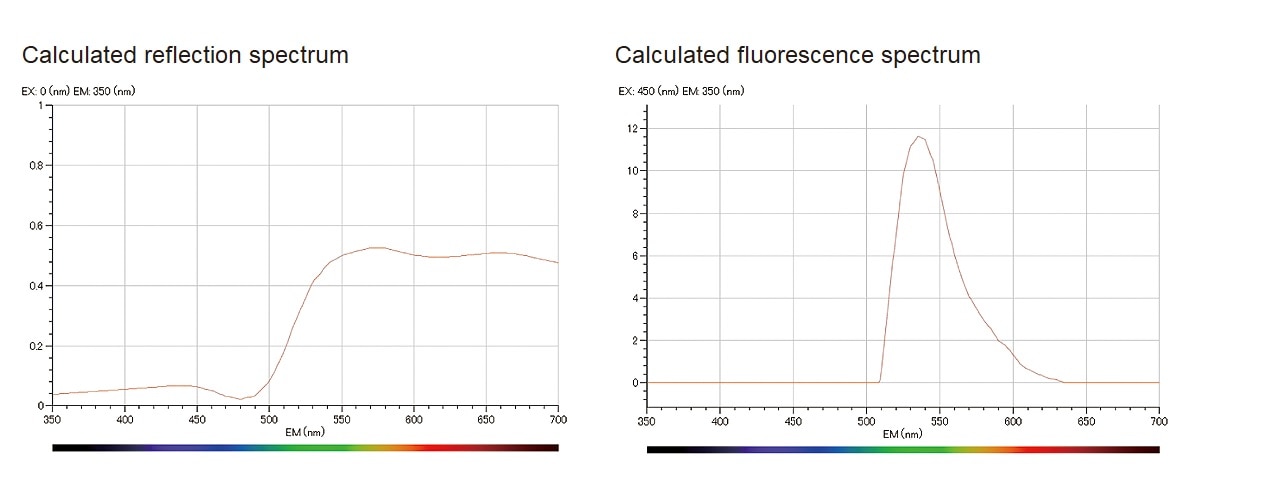
A captured image was separated into a reflected light image and a fluorescence image using an image separation algorithm. The reflection image was orange and the fluorescence image was green. The separated images correspond to the reflection spectrum and fluorescence spectrum, respectively, and by summing the orange reflection image and the green fluorescence image, the sample appears yellowish. It was found that the in-plane optical characteristics (optical pattern) in the reflection image and the fluorescence image were different. When the image was enlarged, it could be seen that the microstructure of the reflecting plate had a period of about 200 μm.
Specifications
Function
| Item | Description |
|---|---|
| EEM View mode (Measurement mode) | Measurement of 3-D fluorescence spectrum |
| Monochromatic light imaging | |
| White light imaging | |
| Preview imaging | |
| Data processing section | Thumbnail displays |
| 3-D fluorescence spectrum display (contour lines, gradation) | |
| Excitation / fluorescence spectrum display | |
| Image zoom function | |
| Partitioned display (1×1, 2×2, 3×2, 4×4, 5×5) | |
| Spectral calculation and display for each partition (fluorescence and reflection)*1 | |
| Separated image display (fluorescence and reflection)*1 |
*1 The spectral analysis algorithm was developed in joint research by Professor Imari SATO and Associate Professor Yinqiang ZHENG of the National Institute of Informatics.
Specification
| Item | Description |
|---|---|
| Irradiation wavelength | 360 to 700 nm |
| Camera | Color (RGB) CMOS sensor |
| Interface | USB 3.0 |
| Effective number of pixels | 1920×1200 (H×V) |
| Photographable wavelengths | 380 to 700 nm |
* Main specifications for the photometer conform to those of the fluorescence spectrophotometer main unit.
Example of configuration
| Name | P/N (Part Number) |
|---|---|
| F-7100 Fluorescence Spectrophotometer | 5J1-0041 / 5J1-0042 |
| EEM View Accessory | 5J0-0570 |
| R928F Photomultiplier | 650-1246 |
| Substandard light source | 5J0-0135 / 5J0-0136 |
Introducing the measurement example using spectrofluorophotometer (FL).
The basics of fluorescence spectrophotometers (FL).