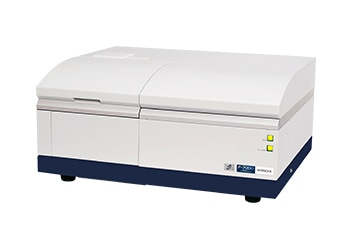
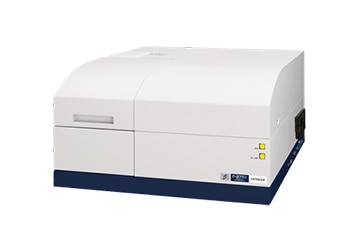
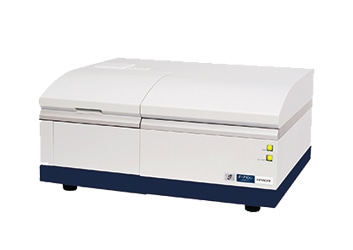
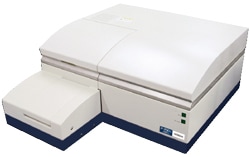
Fluorescence Spectrophotometer F-7100
Hitachi' s Superior Fluorescence Technology has created a new generation of fluorescence spectrometers.
F-7100 is the evolution of the robust and reliable F-7000 with the latest optical technology and improved analytical performance.
- "Best-in-Class" Analytical Signal-to-Noise
- Ultra-Fast Scanning
- 2,500hr Long lifetime light source
- Compact design
- Multiple accessories
With the highest level for 3D fluorescence spectra, F-7100 can be used in a wide range of applications from the cutting edge research to quality control: Applications.
21 CFR Part 11 Compliant software available.
Features
Best-in-Class" Analytical Signal-to-Noise. 360 of S/N (P-P) and > 1,200 of S/N (RMS)
Increased sensitivity 1.5x compared to conventional instruments
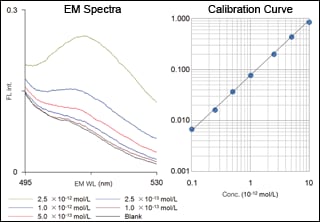
Due to its enhanced sensitivity (1.5x higher), weak signals can be detected with very low noise levels.
An example of the high sensitivity analysis for fluorescein is shown. The F-7100 detected fluorescence in the order of 1x10-13 mol/L (sub-picomol) compared with a blank sample (purified water); a useful calibration was obtained in the ultra-trace range.
Industry leading lamp lifetime
Light source with 5x*¹ longer lifetime compared to conventional instruments – lifetime of 2,500 hours*² –
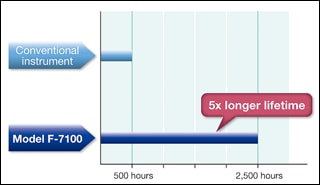
With the application of the new Xe lamp and the improved lamp ignition power source, both luminance and the lamp lifetime were increased.
Increased lamp lifetime reduces operating Cost-of-Ownership and instrument service time.
*1 Comparison with the service life (recommended replacement interval) of the standard Xe lamp (PN: 650-1500) of F-7000 fluorescence spectrophotometer.
*2
Lifetime is usable limit. Guaranty for 500 operating hours or 6 months, whichever shorter.
Troubles due to mishandling are not within guarantee.
High-Speed Scan at 60,000 nm/min – Example of reaction tracing with a spectrum
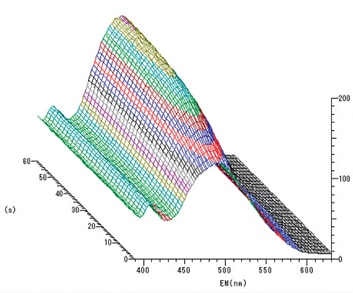
The fast-speed scanning enables users to carry out measurements that have been difficult with conventional instruments. In this example, an isomerization process of coumarin in kerosene was traced by spectrum measurement at 2-second intervals and displayed as a 3-D time-scan spectrum. This is a new function in the F-7000.
Previously, a quick reaction which occurs within 1 minute could be measured only by using the fixed wavelength method. The F-7000 is capable of following such a quick reaction because of its fast scanning, measuring the entire wavelength range within 1 second.
FL intensity standardization to correct for fluorecence intensity variation over time and between instruments
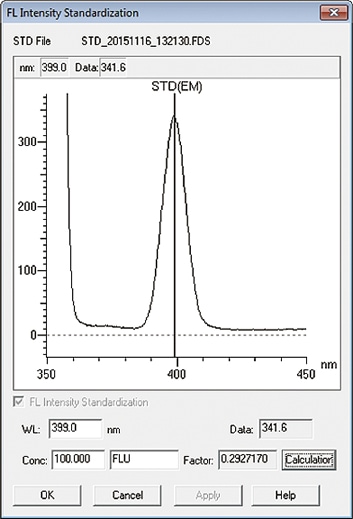
The variations in the fluorescence intensity over time and between instruments can be corrected. Fluorescence intensity is affected by changes in lamp brightness, room temperature, optical system, etc. The fluorescence intensity of the standard sample is measured, and the sample fluorescence intensity is converted to the fluorescence intensity relative to the standard sample. This standardization is also used for the intensity comparison between different instruments, including the analysis of humic substances in environmental water (conversion to quinine sulfate), the analysis of chlorophyll in water (conversion to fluorescein), and the specified value for reagent purity (conversion to quinine sulfate).
Specifications
| Item | Description | |
|---|---|---|
| Sensitivity (Raman light of water) |
Noise: Background | S/N 20,000 or above*3 |
| Noise: Peak | 1,200 or above*4 | |
| Minimum sample volume | 0.6 mL (in use of standard 10 mm rectangular cell) | |
| Photometric principle | Monochromatic light monitoring ratio calculation | |
| Light source | 150 W xenon lamp, self-deozonating lamp house | |
| Monochromator | Stigmatic concave diffraction grating: 900 lines/mm, F2.2 Brazed wavelength: Excitation side 300 nm, emission side 400 nm |
|
| Measuring wavelength range (on both EX and EM) |
200 to 750 nm, and zero-order light (Expandable up to 900 nm with optional detector) |
|
| Bandpass | Excitation side: 1, 2.5, 5, 10, 20 nm Emission side: 1, 2.5, 5, 10, 20 nm |
|
| Resolution | 1.0 nm (at 546.1 nm) | |
| Wavelength accuracy | ±1 nm | |
| Wavelength scan speed | 30, 60, 240, 1,200, 2,400, 12,000, 30,000, 60,000 nm/min | |
| Wavelength drive speed | 60,000 nm/min | |
| 3D measurement time | 3 min*5 | |
| Response | Response from 0 to 98 %: 0.002, 0.004, 0.01, 0.05, 0.1, 0.5, 2, 4 s |
|
| Photometric value range | -9999 to 9999 | |
| Data processing unit | PC : Windows 7 | |
| Printer | Printer compatible with Windows 7 | |
| Dimensions/weight | Spectrophotometer: 620 W × 520 D × 300 H mm(excluding protrusions), 41 kg | |
| Working temperature | 15 to 35 °C, 25 to 80% (condensation not/humidity allowed, 70% or less at 30 °C, or higher) | |
| Power consumption | 100, 115, 220, 230, 240 V AC, 50/60 Hz, 380 VA | |
*3 EX 350nm, Slit 10 nm, Response 4 s
*4 EX 350nm, Slit 5 nm, Response 2 s
*5 EX 200 to 750 nm, Sampling interval 10 nm, EM 200 to 750 nm, Sampling interval 10 nm
Functions
- 3-dimensional measurement
- Wavelength scan
- 3-dimensional scan measurement
- Time scan measurement mode
- Photometry mode
- Others
Options
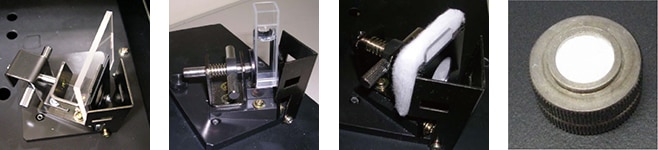
Fluorescence Analysis of a Plate Sample from a Plasma Panel Display
An example of measuring fluorescence spectra of a plasma panel display using a solid sample holder.
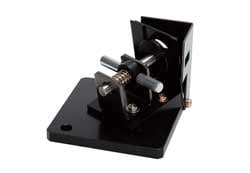
Solid sample holder 650-0161
Example of setting up sample
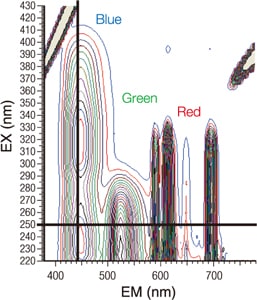
3-D Fluorescence Spectra
The figure shows results of a 3-D measurement on a plasma display panel. On each excitation wavelength, blue, green, and red spectra are observed. The F-7000 series featuring a high scanning speed can obtain the data shown on the right in as little as 1.5 minutes.
3-D assay presents a great deal of information from a single sample preparation process, thus reducing the amount of time required to run measurements. The ultra-high speed scanning of the F-7000 series can be a powerful tool for the measurement of samples that change with time.
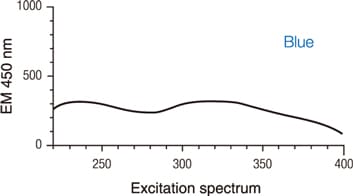
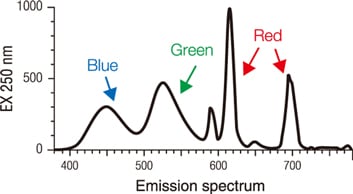
Excitation and Fluorescence Spectra
Results of a 3-D measurement can also be represented in 2-D data. The graphs below show excitation and emission spectra of a plasma display.
It presents spectra at specific wavelengths. By using the blue, green, red spectra data represented in 2-D, the technique can be applied to the measurement of fluorescent colors (fluorescence chromaticity coordinates).
Removing secondary light
In surface light measurements, multi-order light, including second-order light, that is produced by light scattering interferes with the measurement. An effective tool for removing multi-order light is a cut filter. Fluorescence is based on the principles of Stokes, which can be observed at longer wavelengths than the excitation light.
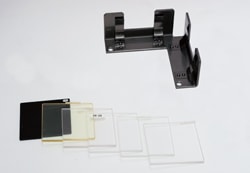
Filter set 5J0-0151
Effects of a cut filter
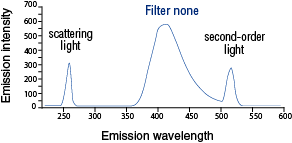
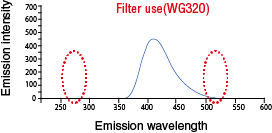
The graphs below show the effects of using a cut filter based on sodium salicylic acid (powder) data. The filter (WG320) cuts the scattered light that would otherwise enter the detector and suppresses the occurrence of second-order light.
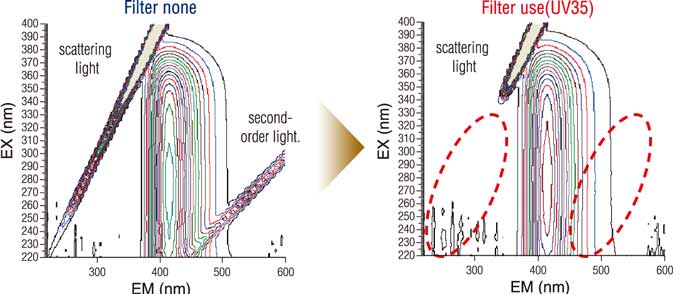
The following graphs also show data that are extracted from third-order data. It is clear that the occurrence of second-order light that is duplicate to the spectra is also suppressed on the second-order data.
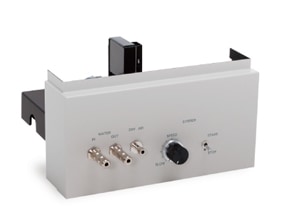
Microplate accessory
The microplate accessory permits the direct assaying using the F-7000 of a sample applied to a microplate.
The accessory lends itself to automation for assaying as a microplate reader or an auto-sampler based upon the use of microplates.
| Compatible microplate | 96 well wells (400 µL, flat bottom) |
|---|---|
| Measuring speed | 96 wells/60 s (in kinetics measurement mode) |
| Thermostatic function | Thermostatic water bath connectable 5 to 60 °C (Thermostatic water bath separately available) |
*1
Compatible microplates are commercially available ones having 96 wells.
Background fluorescence level may be high depending on a selected microplate.
Features of the microplate accessory
- Effective for the assaying of multi-specimen samples : compatible with 96-well microplates
- High-sensitivity assaying : Detection sensitivity : 5×10-11 mol/L (fluorescein)
- High-throughput assaying : 96 wells/60 seconds
- Wide dynamic range : 6 digits or higher
Example of PicoGreen® assay
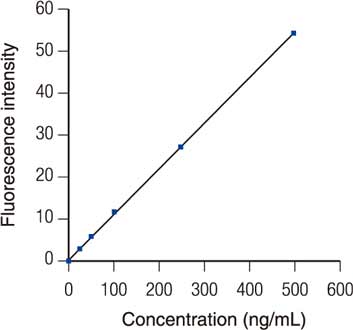
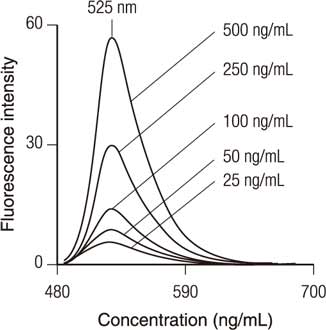
The PicoGreen® can assay double-strand DNA, specifically and in high sensitivity, in a manner immune to the effects of RNA, single-strand DNA or proteins present in the sample. As such, the system is well-suited for the assaying of template amount in a DNA sequencer or PCR.
The use of the microplate accessory supports high-throughput measurement operations.
System for measurement under constant temperature - Measurement of green fluorescent protein (GFP)
Micro cell 650-0116
Typically, an increase in the temperature of a sample by 1°C causes a decrease in its fluorescence intensity by 1 to 2%. In addition, in the biological field, samples are measured in a similar condition to in vivo environment.
Highly temperature-dependent samples and biological specimens should be measured under constant temperature using a thermostat cell holder.
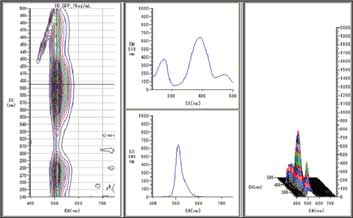
The example shown here displays the fluorescence properties of green fluorescent protein (GFP). GFP is a fluorescent protein existing in Aequorea victoria, which is essential for measurements of intermolecular interactions (FRET, BRET), bioimaging studies, etc.
We measured the 3-D fluorescence spectra of GFP using the microcell with a stirrer. Since the sample solution is stirred with a magnetic stirring bar, measurements can be conducted with a greater accuracy in temperature.
* We have wealth of other optional accessories.
Detection of Food Safety Using Fluorescence Fingerprint

A report on detection of food safety using fluorescence fingerprint, extracted from Scientific Instrument NEWS, a technical magazine of electron microscope and analytical instruments.
Citations
 Powered by Bioz
Introducing the measurement example using spectrofluorophotometer (FL).
The basics of fluorescence spectrophotometers (FL).