
Principle of Differential Thermal Analysis (DTA)
Definitions of Differential Thermal Analysis (DTA)
A technique in which the difference in temperature between the sample and a reference material is monitored against time or temperature while the temperature of the sample, in a specified atmosphere, is programmed.
* This is definition of DTA by ICTAC.
Description of DTA
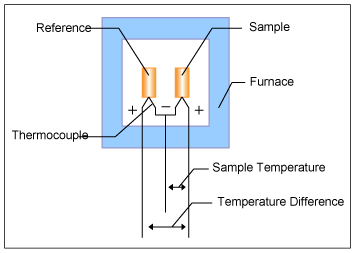
Figure 1 shows the block diagram of DTA.
The sample and the reference are placed symmetrically in the furnace. The furnace is controlled under a temperature program and the temperature of the sample and the reference are changed. During this process, a differential thermocouple is set up to detect the temperature difference between the sample and the reference.
Also, the sample temperature is detected from the thermocouple on the sample side.
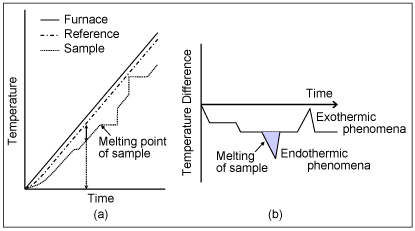
Graph (a) shows the temperature change of the furnace, the reference and the sample against time.
Graph (b) shows the change in temperature difference (ΔT) against time detected with the differential thermocouple.
ΔT signal is referred to as the DTA signal.
Matters that do not change in the measurement temperature range (usually α-alumina) are used as reference.
When the furnace heating begins, the reference and the sample begin heating with a slight delay depending on their respective heat capacity, and eventually heat up in according to the furnace temperature.
ΔT changes until a static state is reached after the heating begins, and after achieving stability, reaches a set amount compliant with the difference in heat capacity between the sample and the reference. The signal at the static state is known as the baseline.
When the temperature rises and melting occurs in the sample, for example, the temperature rise stops as shown in graph (a) and the ΔT increases. When the melting ends, the temperature curve rapidly reverts to the baseline.
At this point, the ΔT signal reaches the peak, as shown in graph (b).
From this, we can detect the samplefs transition temperature and the reaction temperature from the ΔT signal (DTA signal).
In graph (b), the temperature difference due to the samplefs endothermic change is shown as a negative direction and the temperature difference due to the samplefs exothermic change is shown as a positive direction.
Definitions of Thermal Analysis and Viscoelasticity
- Definitions of Thermal Analysis
- Definitions of Differential Scanning Calorimetry (DSC)
- Definitions of Thermogravimerty (TG)
- Definitions of Differential Thermal Analysis (DTA)
- Definitions of Thermomechanical Analysis (TMA)
- Definitions of Dynamic Mechanical Analysis (DMA)