3D Visualization Software Hitachi map 3D
Three-dimensional models allow Z-height Measurements
Using Hitachi' s latest high speed, 4-segment Backscattered Electron Detector, a three-dimensional model can be generated without sample tilting or manually collecting consecutive images.
- Directly edits on the flexible layout display.
- Supports various measurements such as height, area, and volume as well as ISO-compliant□surface roughness.
- Automated and traceable analysis workflow including report creation.
Features
Hitachi map 3D Software Overview
Hitachi map 3D generates three-dimensional images without sample/stage tilting or image shift.
Hitachi map 3D captures all four directional images simultaneously with a high-speed, segmented Backscattered Electron Detector (BSED).
Flexible Profile Analysis
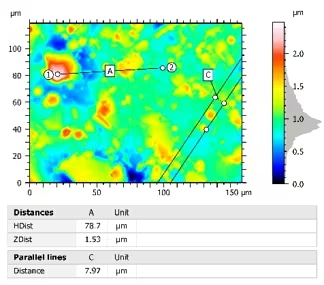
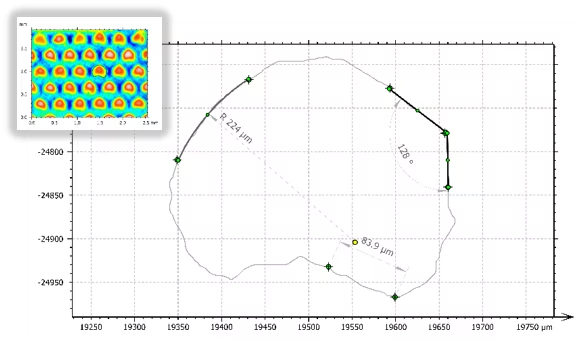
Automatically collects data from the sample surface or cross-sectional profile for surface roughness and structural height, or makes various measurements between the 2 points.
- Cross-sectional profile display from any points within the 3D map
-
Measurement location can be selected freely from vertical, horizontal, and diagonal points from the 3D image.
Whenever the measurement location is changed, the measurement results respond in real time.
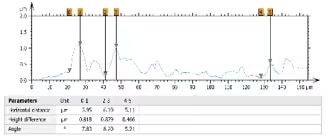
- Height and angle measurements are possible on the user defined line profile.
-
X, Y, and Z analysis between 2 points on the surface or cross section.
Distance, Z-height, slope, or angle can be measured between 2 points on the 3D map image.
High-definition 3D Image Display
- Numerous 3D rendering modes are user selectable for surface characterization. Animations can be applied to the 3D image and saved as a video file.
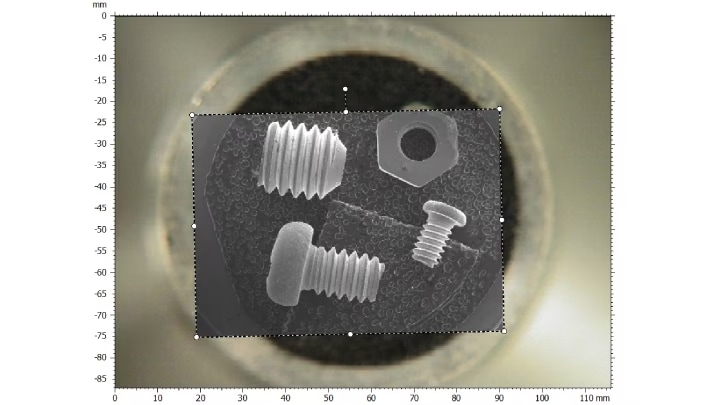
Sample:Screw
A Wealth of Report and Measurement Functions
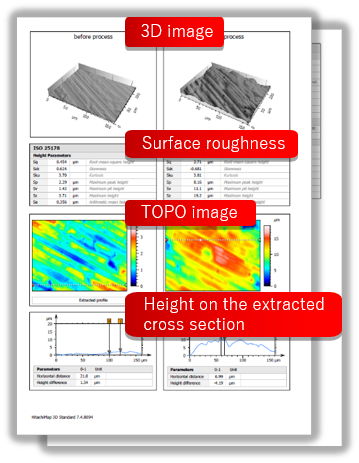
- Surface and line profile roughness measurements can be made on any area of the 3D reconstructed image.
- Any sample results before and after the processing can be simultaneously displayed side by side on a report layout.
Various Output Formats Supported
- Report data can be output to several formats including RTF (Word-compatible), PDF, and more.
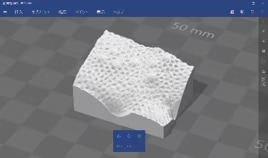
- Three-dimensional reconstruction data can be output in txt, STL format (3D printer compatible), and more.
Full-Featured Help Function in Multiple Languages
- The help function describes the formulas used for each measurement mode.
- Available in 11 languages.
Specifications
| Item | Description |
|---|---|
| Import function | Automatic select and read function of four segment BSE image data |
| Measurement performance | Measurement performance varies depending on calibration accuracy, the condition of the type of specimen, the observation mode, and the observation condition. Detectable angle range ±60° (reference) TM4000 ±50° (reference) |
| Measurement Function | Section profile display extracted between any area on the three dimensional image |
| Distance of X and Y, length and any angle measurements between two points, surface area, and volume | |
| Distance of X, Y, and Z, length and many other measurement functions between 2 points specified on section profile | |
| Simple profile and surface roughness measurements | |
| Baseline (straight, curve), leveling, and multiple offsets | |
| Cutting surface, Color contour line, Bird' s-eye view, and pseudo color display | |
| Layout, templates, and image composition from multiple-image function | |
| Three-dimensional display function | Rotation, zoom-in, and multiple rendering processes. Animation video record function of observation screen |
| Output function | Report/image: PDF, RTF/PNG, JPG, GIF, TIF, BMP, EMF |
| 3D image/movie: SUR, 3MF, STL, WRL, TXT/X3D/WMV, AVI |
Application Data1
Basic Functions for Height Analysis
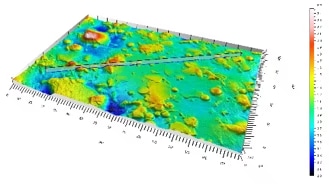
3D View
- The sample can be observed from any direction from the 3D map view of the surface.
Contour Lines Display
- Contour lines display available.
Color Editor
- Apply pseudo coloring to SEM images.
Application Data2
Effective 3D Analysis Functions
3D Stitch
- Large areas can be automatically stitched from multiple contiguous 3D-reconstruction regions of interest.
Contour Analysis
- Diameter, angle, etc. can be measured on the extracted area or line profile.
3D Reconstruction by Stereotypic Images
- Reconstruction of 3D images by using either BSE or SE images.

Correlative Microscopy
- Correlate electron and optical images with Hitachi map 3D.
3D Gallery
Hitachi map 3D Adds Depth to Your SEM Data
Hitachi map 3D allows you to augment your 2D SEM data with Z-height information
Electronics
Sample: Fractured surface of semiconductor
Signal: Backscattered electrons
Magnification: 1,000x
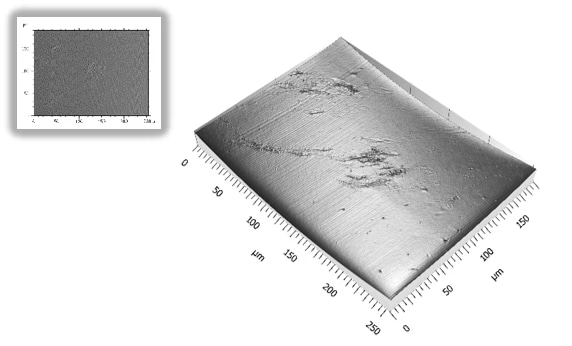
Sample: Defect surface on the connector
Signal: Backscattered electrons
Magnification: 1,200x
Materials
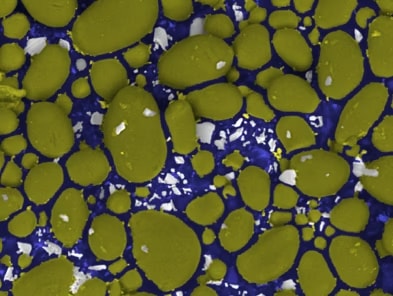
Sample: Solar cell
Signal: Backscattered electrons
Magnification: 2,000x
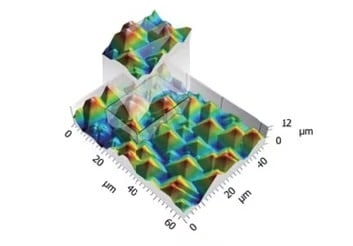
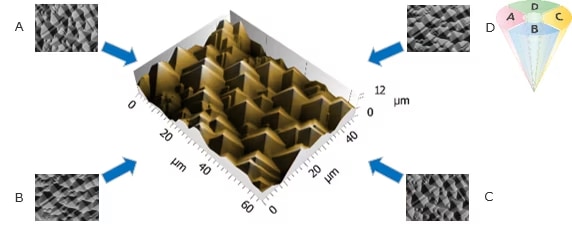
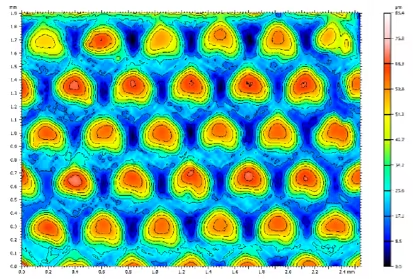
Sample: Micro-lens array
Signal: Backscattered electrons
Magnification: 2,000x
Biology
Sample: Boiled egg yolk
Signal: Backscattered electrons
Magnification: 200x
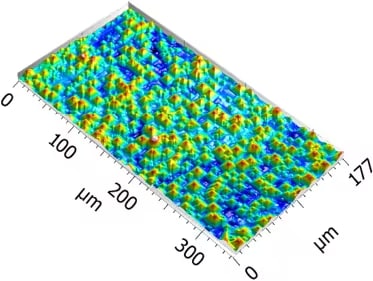
Sample: Compound multifaceted eyes of dragonfly
Signal: Backscattered electrons
Magnification: 1,000x
Sample: Hair
Signal: Backscattered electrons
Magnification: 1,000x
Related Information