


Quantitative Automated Mineralogy for Ore and Process Mineralogy Labs
Provided by Environmental Business Division | Published: November 12, 2026
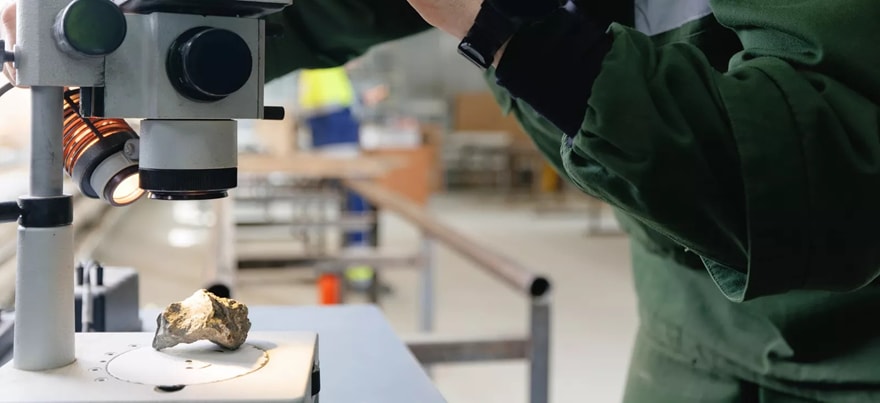
Assay grade alone rarely explains why a flotation circuit underperforms or why a concentrate carries penalty elements. Those answers usually sit at the particle level, which is where quantitative automated mineralogy earns its place in ore and process mineralogy labs.
Optical microscopy and manual point counting still have value, but they are slow and depend heavily on the operator. Automated systems pair scanning electron microscopy with energy-dispersive X-ray spectroscopy (EDS), classify thousands of particles in one run, and turn images into repeatable numbers. For geometallurgists and plant metallurgists, those numbers support faster and more confident decisions.
What Quantitative Automated Mineralogy Measures in Ore Samples
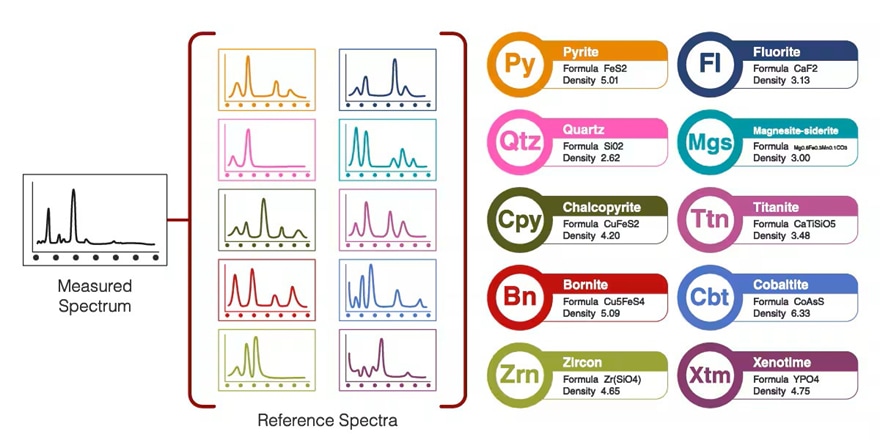
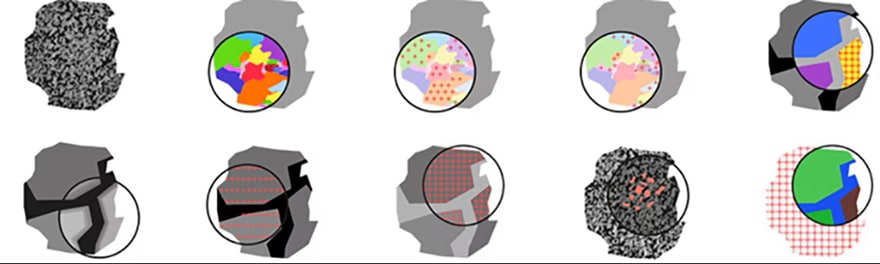
At its core, quantitative automated mineralogy turns a polished sample into a mineral map. The process starts with backscattered electron (BSE) images from a scanning electron microscope, where gray levels separate phases by average atomic number. EDS spectra then identify each phase against a reference library, and software assembles the results into classified particle maps and data tables.
Typical outputs include:
- Modal mineralogy: The area or mass percent of each mineral in the sample.
- Liberation and locking: How much of a valuable mineral is free, and what it is locked with.
- Grain and particle size distribution: The size of target minerals inside each particle.
- Mineral associations: Which minerals share boundaries with the payable phase.
- Elemental deportment: Which minerals host a target or penalty element.
- Calculated assay: A chemical grade derived from mineral data, useful as a check against lab assays.
How Process Mineralogy Labs Use Quantitative Automated Mineralogy Data
Process mineralogists want to know why the plant behaves as it does. Particle-level data links ore texture directly to circuit performance.
Tailings studies are a common starting point. Mineral maps show whether lost value sits in fine, locked, or composite particles, and each answer points to a different fix. Fine losses may call for flotation changes, while locked particles may justify a finer grind or a regrind stage.
Geometallurgy programs use the same data at a larger scale. Labs map drill core samples to define ore domains by mineralogy and texture, and those domains feed recovery forecasts in the mine plan.
Concentrate quality is another driver. Deportment data shows which minerals carry arsenic or other penalty elements, so metallurgists can target rejection where it matters most. The same approach also supports recycling labs studying battery black mass.
Sample Preparation and Imaging Conditions That Protect Data Quality
Automated results are only as good as the sample on the stage. Representative splitting comes first, since poor subsampling can skew modal results before any imaging begins.
Dense minerals tend to settle in epoxy and bias the polished surface, and many labs reduce this with filler materials or vertically sectioned mounts. The final surface should be flat, scratch free, and low in relief. Fine-grained or delicate samples may benefit from flat ion milling as a final step, using a system such as the ArBlade 5000.
Imaging conditions matter just as much. A stable beam current keeps BSE gray levels consistent across long runs, and regular calibration against standards protects phase segmentation. Carbon coating or variable-pressure operation controls charging, and the reference library should be validated on known samples before production work starts.
Hitachi SEM Platforms and AMICS Software for Ore Labs
Hitachi High-Tech supports quantitative automated mineralogy through AMICS, the Automated Material Identification and Classification System. AMICS integrates Bruker® EDS with Hitachi SEM platforms and offers ten large-area mapping measurement modes and a reference database of over 40,000 mineral and material spectra. Outputs include modal mineralogy, liberation, locking, and calculated assay data, and open file formats and a Python toolkit keep data accessible for custom work.
Labs can match the platform to their throughput and setting:
- SU3900 and SU3900SE: Large-chamber SEMs for routine and high-volume mineralogy, with the SU3900SE adding a Schottky FE source.
- SU7000 and SU8700: Schottky FE-SEMs for demanding analytical work, with the SU7000 offering up to 200 nA of beam current.
- FlexSEM 1000 II: A compact SEM that runs on a standard wall outlet, suited to single research groups and on-site labs.
- TM4000PlusIII and TM4000III: Tabletop microscopes for routine checks where space is tight.
From Mineral Maps to Mine Plans with GeoMineral AI Insights
Quantitative automated mineralogy pays off when its numbers reach the people who plan the mine and run the plant. Hitachi electron microscopes and AMICS are part of a larger mining solution from Hitachi, GeoMineral AI Insights, built for that step.
Instead of moving data into a new system, the platform connects it where it already lives. It builds a knowledge graph of assay, spatial, mineral, and operational data, and AMICS results flow into that graph with full provenance preserved. XRF, ICP, and existing LIMS data can join the same graph. For ore and process mineralogy labs, three capabilities stand out:
- Traceability: Any sample, lot, or assay result can be traced through its full data lineage, including battery-passport provenance for critical-mineral feedstocks.
- Dashboards in plain language: Teams describe the dashboard they need, and it is built over live AMICS, XRF, and LIMS data without writing SQL.
- Regulatory-ready reporting: Templates for NI 43-101, JORC, and SAMREC come with chain of custody, e-signature, and audit trail built in.
The platform runs on premises or in a cloud the customer chooses, and data exports in open formats such as Apache Parquet™, a natural match for the open file formats AMICS already uses.
Turn Your Next Ore Sample Into Clear Answers
Our application specialists can walk through your current workflow and look at your samples, throughput goals, and reporting needs. From there, you can choose the setup that fits your lab, from compact systems to high-throughput platforms. Contact our team to discuss your ore samples and request a demonstration.
* Apache Parquet™ is a trademark of The Apache Software Foundation. All other trademarks are the property of their respective owners.