


SEM Workflows for Mineralogy and Mining Sample Analysis
Provided by Environmental Business Division | Published: November 19, 2026
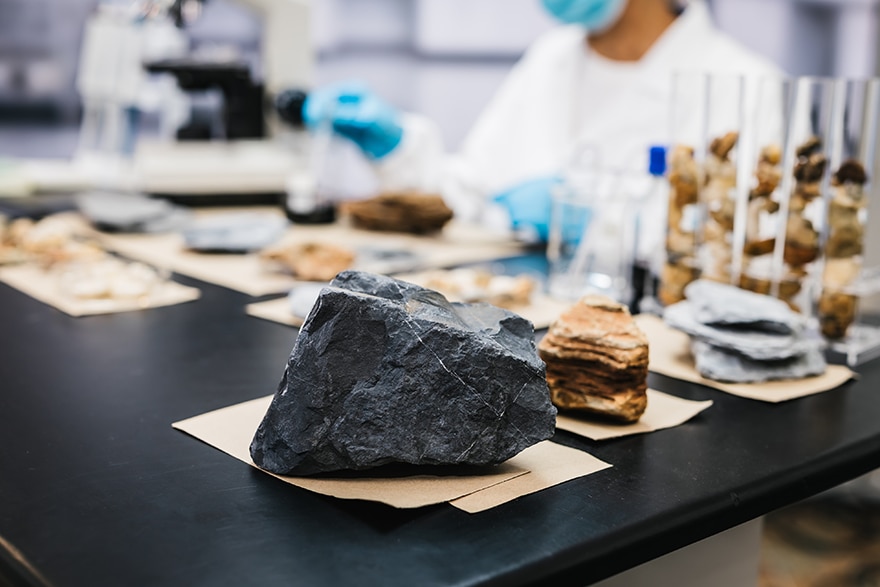
Grain size, mineral associations, and liberation shape how a deposit behaves during processing. Measuring them accurately is essential for better recovery and lower costs, which is why SEM for mineralogy and mining applications has become a core tool in modern geoscience labs.
Scanning electron microscopy combines high-resolution imaging with elemental analysis on a single platform. Still, the real value comes from the workflow around the instrument. This article walks through how labs prepare samples, collect and automate mineral analysis, and connect lab results to decisions across the mine.
The Role of SEM for Mineralogy and Mining Applications
Optical microscopy remains useful, but it has limits at fine grain sizes. A modern scanning electron microscope resolves features far below the optical range and pairs imaging with chemical data in a single session.
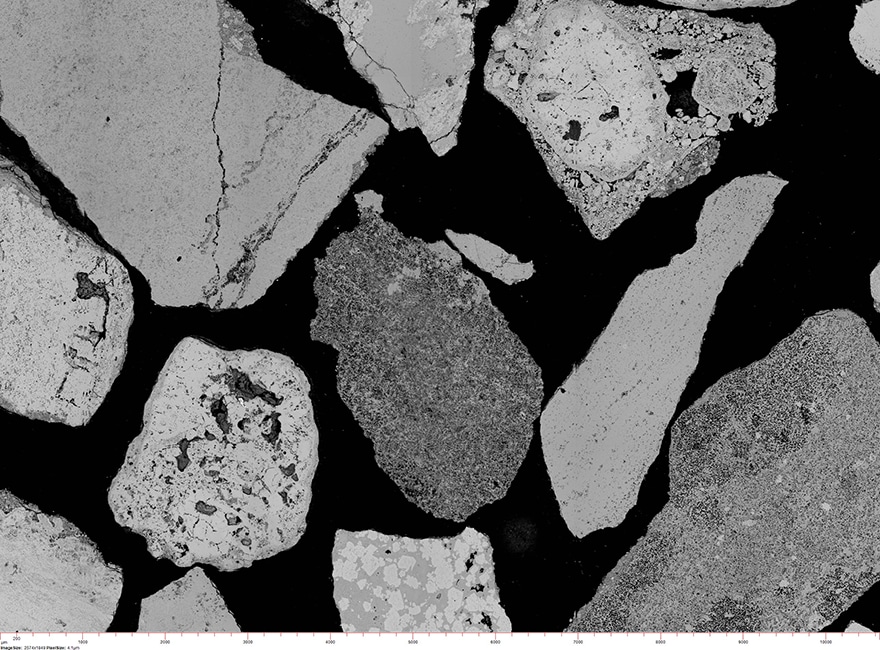
Backscattered-electron (BSE) imaging is the workhorse signal for geological samples. Brightness in a BSE image scales with average atomic number, so heavy minerals such as galena appear bright while quartz and feldspar appear darker. Energy-dispersive X-ray spectroscopy (EDS) then confirms the elements present at each point.
This pairing of contrast and chemistry is what makes SEM for mineralogy and mining applications so practical. Exploration teams use it to characterize drill core. Process engineers use it to study liberation and losses to tailings. Geometallurgists combine both views to predict how ore will behave in the plant.
Sample Preparation for Mineral and Ore Specimens
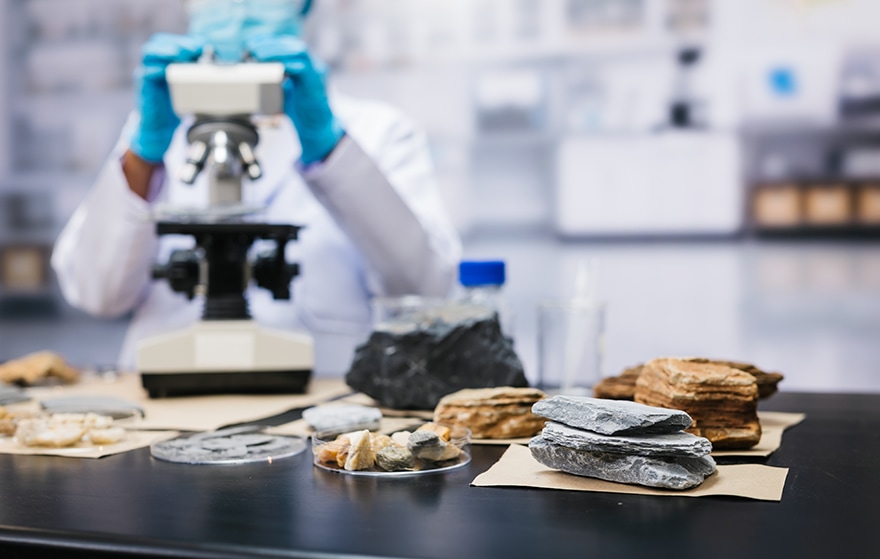
Most mining samples arrive as crushed particles, drill core, or hand specimens. Labs typically set particulates in epoxy to create grain mounts, while core and rock fragments become polished blocks or thin sections.
A flat, clean surface matters. Topography distorts BSE contrast and can mislead phase segmentation, and rough surfaces skew EDS results. Mechanical polishing works well for many samples, but it can leave relief between hard and soft minerals or smear clays. Broad ion beam milling offers a gentler final step for fine-grained ores and porous rocks.
Most minerals are insulators and will charge under the beam. A thin carbon coat is the common fix, and variable-pressure SEM modes offer another route when coating is not desirable.
Automated Workflows in SEM for Mineralogy and Mining Applications
Manual point analysis works for a few grains, but it does not scale to the thousands of particles a plant decision requires. Automated mineralogy closes that gap. The system collects BSE images across the sample in a tiled pattern, segments particles and grains by contrast, and matches EDS spectra from each grain against a mineral reference library.
The outputs translate directly into process insight:
- Modal mineralogy: The relative abundance of each mineral phase.
- Liberation and locking: How freely valuable minerals are exposed for recovery.
- Grain size distribution: The size range of target and gangue minerals.
- Elemental deportment: Which minerals host an element of interest, such as nickel or rare earths.
- Mineral associations: Which phases touch or enclose each other.
Because the same recipe runs the same way on every sample, results stay consistent, and unattended runs let labs measure overnight.
Hitachi SEM Solutions for Mining and Geoscience Labs
AMICS software turns compatible Hitachi SEMs into automated mineral analysis systems. It works with Bruker® EDS and draws on a reference database of over 40,000 mineral and material spectra. Labs can match the platform to their throughput and space:
- SU3900 and SU3900SE: Large-chamber SEMs for routine and high-volume mineral analysis.
- SU7000 and SU8700: Schottky FE-SEMs for high-resolution work, with the SU7000 offering beam currents up to 200 nA for fast EDS mapping.
- FlexSEM 1000 II: A compact variable-pressure SEM only 450 mm wide that fits smaller or shared lab spaces.
- TM4000PlusIII and TM4000III: Tabletop microscopes for routine mineral checks in smaller labs.
The ArBlade 5000 Ion Milling System prepares cross sections and flat surfaces without mechanical stress, and Hitachi application specialists work alongside customers to build recipes that fit their ores.
Connecting Lab Results to Mine-Wide Decisions
Mineral data is most useful when it reaches the people planning the mine and running the plant. Hitachi electron microscopes and AMICS are part of a larger mining solution from Hitachi called GeoMineral AI Insights.
The platform builds a knowledge graph that connects exploration, lab, and operations data. Data stays where it lives today, so there is no migration, and AMICS results flow into the graph with full provenance preserved. Four AI agents work on top of that graph:
- Discovery Agent: Ask questions about geochemistry and mineralogy data in plain English.
- Traceability Agent: Trace any sample, lot, or assay result through its full data lineage.
- Dashboard Agent: Build dashboards over live AMICS, XRF, and LIMS data without writing SQL.
- Configuration Agent: Onboard new instruments and data sources by generating parsers from their output files.
For public reporting, GeoMineral AI Insights includes templates for NI 43-101, JORC, and SAMREC, with chain-of-custody, e-signature, and audit trail built in. It runs on premises or in a cloud the customer chooses, and data exports in open formats.
The platform also anchors the Critical Mineral Map of Canada, a mineral-sample database run in partnership with the Saskatchewan Research Council. That database is populated automatically from AMICS analyses on the Hitachi SU3900SE FE-SEM, a clear example of SEM data moving from the lab into a shared resource.
Take the Next Step Toward Faster Mineral Insight
You may need sharper liberation data, faster turnaround, or a more consistent lab routine. Our team can help you compare platforms, review your samples, and plan a workflow that fits your deposit and flowsheet. Contact our microscopy specialists to start building your mineral analysis workflow.
* Bruker® is a registered trademark of Bruker Corporation. All other trademarks are the property of their respective owners.