
Principle of XRF Analysis
Descriptions
Here we introduce the principle and application examples of X-ray fluorescence.
1. Principle
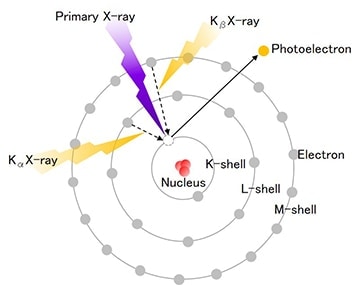
X-rays are a type of electromagnetic wave comparable to visible light rays but with an extremely short wavelength that measures from 100A to 0.1A. Compared to normal electromagnetic waves, X-rays easily pass through substances and become stronger as the atomic number of a substance through which it passes decreases. X-ray fluorescence analysis is a method that uses characteristic X-rays (fluorescent X-rays) generated when X-rays irradiate a substance. Fluorescent X-rays are electromagnetic waves that are created when irradiated X-rays force inner-shell electrons of the constituent atoms to an outer shell and outer shell electrons promptly move to inner shells to fill the vacancies. Figure 1 shows how fluorescent X-rays are produced. These fluorescent X-rays possess energies that are characteristic to each type of element enabling qualitative analysis by using Moseley's law and quantitative analysis by using the intensity (number of photons) of each X-ray energy.
X-ray fluorescence analysis can be thought of as spectrochemical analysis within an X-ray region. It has the same characteristics as atomic absorption spectrometry and optical emission spectrometry except that the sample does not need to be dissolved in a solution to be analyzed. Flameless atomic absorption spectrometry (FLAAS) atomizes the elements in a sample in a 2000 to 3000C flame. ICP optical emission spectrometry (ICP-OES), excites a sample in a 6000 to 9000C plasma flame. X-ray fluorescence likewise excites the sample to obtain information from X-rays.
2. Instrument Configuration
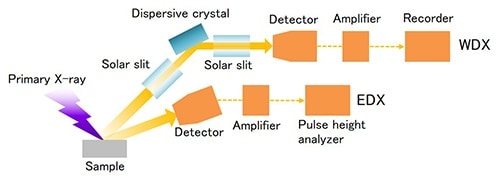
X-ray fluorescence analysis instruments can be largely categorized into wavelength-dispersive X-ray spectroscopy (WDX) and energy-dispersive X-ray spectroscopy (EDX). (See Figure 2.) WDX disperses the fluorescent X-rays generated in a sample using an analyzing crystal and a goniometer, resulting in the instrument being large in size. On the other hand, the detector in EDX has superior energy resolution and requires no dispersion system, which allows the instrument to be smaller in size.
2-1 X-Ray Generation
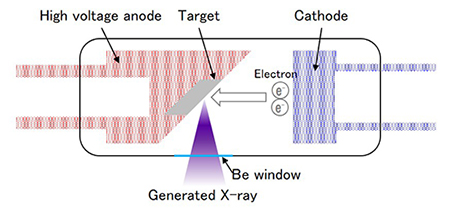
X-rays are generated when the X-ray tube (Figure 3) accelerates electrons at a high voltage and bombards them against a metal anode (anti-cathode). There are two types of X-ray tubes, the side window type and the end window type. Both are designed to irradiate intense X-rays on the sample surface as evenly as possible.
A beryllium foil is commonly used as a window for retrieving incident X-rays. Tungsten, rhodium, molybdenum and chromium are examples of anti-cathodes. Anti-cathode is also referred to as the gtargeth. The anti-cathode is chosen based on what type of samples will be analyzed. X-ray tubes with anti-cathodes the same as elements being analyzed should not be used.
2-2 Detector
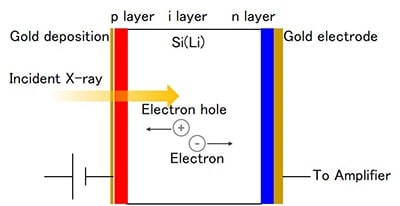
Figure 4 shows the basic structure of a Si (Li) detector. The Si (Li) detector features a p-i-n-type diode. The diode can only pass an electric current in one direction (rectification mechanism). When a voltage is applied against the current (reverse bias) and light is allowed to enter, the electrons in the forbidden band are excited into a conductive band and only the current for the excited electrons will travel. X-ray detection is performed by measuring, one by one, each current pulse that corresponds to an incident X-ray photon. The instantaneous current value of a single pulse is proportional to the incident X-ray energy, and thus the X-ray energy can be found by measuring the pulse height of the current pulse.
The Si (Li) semiconductor detector is a diode with Li drifted over a high-purity single Si crystal, at a diameter of 3 to 6mm and thickness of 3 to 5mm, cooled by liquid nitrogen, and maintained in a vacuum. The field-effect transistor is also cooled by liquid nitrogen. Reports about the first developed semiconductor detector indicated that damage was caused by applying a high voltage resulting from a shortage of liquid nitrogen and consequent rise in temperature. The surface temperature of todayfs detectors is monitored so that when it rises above a certain temperature, a protection circuit shuts off the high voltage to the detector, eliminating damage to the detector from an accidental high voltage. At low frequency of use, the detector can be used 30 minutes after supplying it with liquid nitrogen.
2-3 Sample Chamber & Measurement Atmospher
There are two types of sample chambers: the top-surface type that irradiates X-rays from above and bottom-surface type that irradiates X-rays from below. There are not many differences between these two types in terms of detection, but sample observation and measurements conducted with stage travel are easier with top-surface irradiation.
In most X-ray fluorescence analysis instruments, the atmosphere in sample chambers can be reduced to vacuum conditions. The reason for this is because X-rays are absorbed and lose intensity under normal atmospheric conditions and measurement of lighter elements requires vacuum conditions.
3. Qualitative Analysis
Characteristic X-ray peak energies increase as the atomic number of the substance increases The Qualitative Analysis of fluorescent X-ray analysis uses this regularity. Computer software qualitatively determines the composition of the sample. Most X-ray fluorescence analysis instruments are equipped with an automatic identification (definition) feature but it is important to be aware of various interfering spectrums.
Energy positions of characteristic X-rays may be close to each other or their peaks may overlap depending on which elements are contained in the sample. Figure 5 shows an example of As and Pb spectrums.
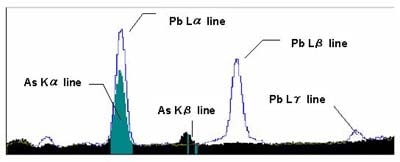
The figure above shows a sample that contains Pb but not arsenic. The energy position of the Kα line of arsenic (As) overlaps with the Lα line of Pb, resulting in the possibility of arsenic being identified by mistake. An element will have multiple characteristic X-rays such as Kα line, Kβ line, Lα line, Lβ line. Confirmation with the KLM marker shown in Figure 6 is necessary in such cases. The KLM marker compares the intensity and theoretical energy positions of multiple characteristic X-rays. Figure 6 shows an example of the KLM marker of Pb displayed on the spectrum.
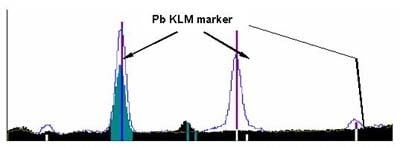
The X-ray intensities of Pb are shown here. If the sample contains Pb, a peak should be present at each energy position and at the same intervals as indicated by the KLM markers. If a peak is present only at the Lα line of Pb but not at the other Pb energy positions, then we can conclude that the sample does not actually contain Pb. Likewise, if there are no peaks at the Kα line and Kβ line of arsenic, then the sample does not contain aresenic. Qualitative analysis, thus, can be accurately performed by displaying the KLM marker and observing the intensity comparison of multiple characteristic X-rays.
4. Quantitative Analysis
This section gives an overview of how quantitative analysis is performed using fluorescent X-rays.
Fluorescent X-rays of element A, for example, is generated when a sample that contains element A is irradiated by primary X-rays. The intensity of the fluorescent X-rays depends on how much of element A the sample contains. The intensity of the fluorescent X-rays of element A will be higher as more of element A is contained in the sample. This process can be done in reverse if the fluorescent X-ray intensity and concentration of an element contained in a sample are known, allowing us to find how much of element A is contained in another sample by its fluorescent X-ray intensity.
There are two basic methods of quantitative analysis by with fluorescent X-rays. The first method is to create a calibration curve. This method involves measuring several samples of known element concentration and finding the relationship between the intensity of the measured element's fluorescent X-rays and the concentration. This relationship allows you to obtain the element concentration of an unknown sample from its fluorescent X-ray intensity.
The other method is known as the fundamental parameter method of theoretical calculation or the FP method. This method allows you to theoretically derive the intensity of the fluorescent X-rays if the type and properties of all elements that compose a sample are known. The composition of the unknown sample can be extrapolated by the fluorescent X-ray intensities of each element.
5. Conclusion
Since X-ray fluorescence analysis can analyze a sample non-destructively and quickly, it can be applied to a wide range of uses such as manufacturing and quality control. Recently, the quantitative analysis of trace elements became possible because of high-sensitivity technologies such as filtering, which eliminates background interference, and thin film methods. In the future, X-ray fluorescence analysis will become more widespread particularly in measuring hazardous metals in materials and soils.