2. Measurement Examples
2-1. High precision observation of high aspect ratio surfaces
When measuring steep slopes, such as in Figure 2-1; in the DFM mode, the shape of the sample cannot be measured accurately because the tracking deteriorates at the descending slope. On the other hand, in SIS mode, since the probe touches the sample only in points where measurement is made, the distance between the probe and the sample remains constant even in steep slopes. Therefore, even a sample with large uneven parts or samples with complex structures, it is possible to easily measure the precise topography.
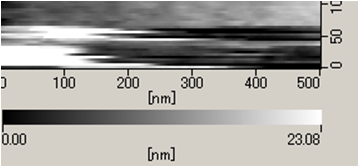
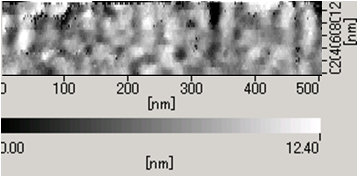
Figure 2-2 is the result of the measurement in the DFM mode and SIS-Topography mode of a sample with large uneven parts. In the sample line profile that was measured by DFM mode, the downward slope cannot be followed, and the line profile just became slanted. However, in the SIS mode, the topography can be measured accurately even in downward slopes. Thus, the SIS mode makes possible the easy observe of exact topography in a sample with large uneven areas and samples with steep slopes.

Figure 2-1 movement of the probe in steep slopes (left: DFM mode, right: SIS-Topography mode)
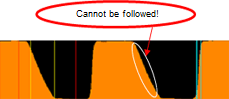
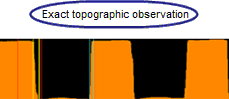
Figure 2-2 Line profile of sample that have large uneven areas (left: DFM mode, right: SIS-Topography mode)
2-2. Stable observation of soft and/or adhesive samples.
Figure 2-3 is the result of the measurement of the adhesive material in DFM mode and SIS-Topography mode. In the DFM mode, as a whole, the horizontal lines of the images are blurred. This is because the probe was adsorbed and thus the feedback control was interrupted. On the other hand, in the SIS mode, we have obtained an image that is clear and without horizontal lines.
Figure 2-4 is the result of the measurement of a chromosome in a solvent solution. In the DFM mode, horizontal lines and spike noise can be seen in the portion indicated by the arrow, but in the SIS mode, there are no noises and a beautiful topography has obtained. Measurements in liquid is different from measurements in the atmosphere, the liquid can prevent the oscillation of the cantilever, and so setting the measurement parameters and adjusting the oscillation condition can be difficult; however setting the parameters is very easy in the SIS mode, thus stable measurement can be achieved.
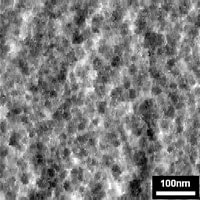
Figure 2-3 Measurement results of adhesive materials (Left: DFM mode, right: SIS-Topography mode)
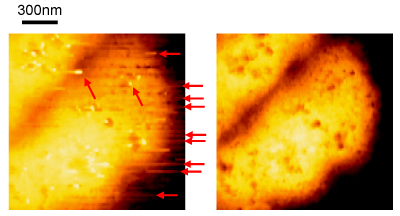
Figure 2-4 Measurement results of a chromsome in liguid (Left: DFM mode, right: SIS-Topography mode)
2-3. Stable phase measurements
In measurement of physical properties, the most common measurement is DFM / phase measurement, where the sample properties, such as adsorption and viscoelasticity properties of the sample surface can be measured through the phase delay of the cantilever oscillation. Figure 2-5 is a result of the phase measurement by DFM mode and SIS-Topography mode of lamella crystals on a PET sheet. The topography shows only the image as measured by SIS-Topography mode. In the DFM / phase image, the left side of the lamella crystals is brighter and the right side is darker. This is due to feedback error, and that the probe is affected by the movement in horizontal direction. On the other hand, in the SIS / phase image, the part of the lamella crystals is in a bright contrast, and the image can be clearly seen without being affected by the topography.
Figure 2-6 is the phase measurement result of adhesive material as measured in the previous section. In the DFM mode, a clear phase image as clear as the topographic image was not obtained; however, in the SIS mode, a clear topographic image as well as a clear phase image can be observed. Thus, the SIS mode can perform stable measurement more accurately with regard to phase measurement as well as topographic measurement.
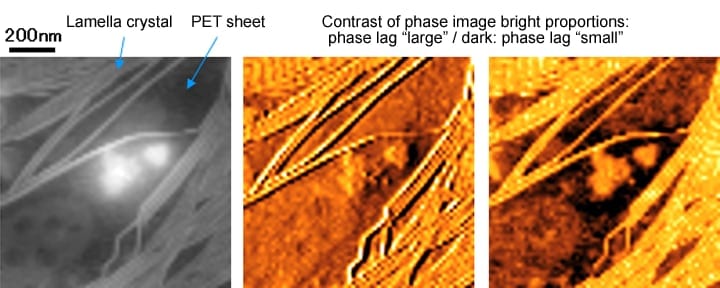
Figure 2-5 Polymer film measurement results (left: shape image, Medium: DFM / phase, right: SIS / phase)
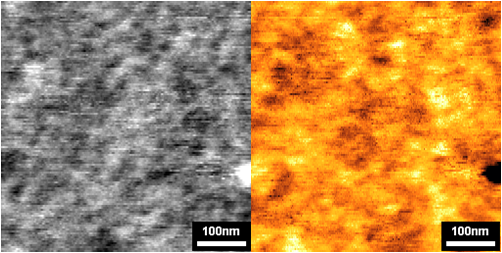
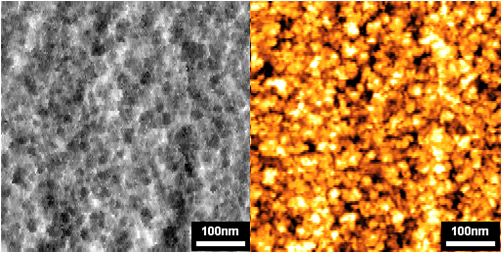
Figure 2-6 Adhesive materials measurement results (Left: DFM mode, right: SIS-Topography mode)
2-4. Stability and high sensitivity measurement of current mode
In the current mode, it is possible to observe the conductivity of the sample surface by applying voltage between the sample and the probe and measuring the current flowing through a conductive cantilever. In the conventional method (AFM-CURRENT mode), because the measurement is done with the probe and the sample in contact with each other, deformation or dragging of the sample becomes a problem. In the SIS mode, since the measurement is not affected by the movement in horizontal direction, stable measurement of even soft samples can be done without deformation and horizontal lines.

Figure 2-7 is a result of the current measurement of the soft conductive material by AFM mode and SIS-Property mode. In the AFM mode, the sample got deformed, but in the SIS-Property mode, the sample did not get deformed and stable measurements of the current and topographic images can be performed. Thus, in the SIS-Property mode, stable current measurement can be achieved.
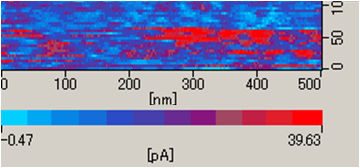
<AFM mode>
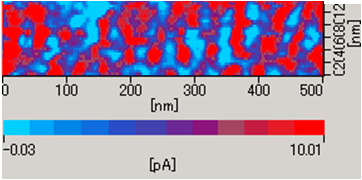
<SIS-Property mode>
Figure 2-7 Measurement result of soft conductive material (above: AFM mode, below: SIS-Property mode)
Page 3 of 3
Products & Services
Hitachi High-Tech Social Media