
Reaction Curve Fitting Tool MiRuDa
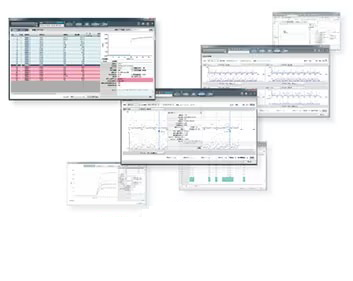
MiRuDa is a tool for efficiently assessing the status of the instrument, reagents, and related components using reaction curve data output from the analyzer. It performs real-time analysis of individual reaction curves, supporting the practical use of reaction curve data in routine testing.
In recent years, clinical laboratories have been expected to manage the entire analytical workflow from pre- to post-analysis, including quality control, to report reliable test results. To enhance reliability, it has become increasingly important to verify reaction curve data from patient samples and confirm the status of instruments and reagents.
This page contains product information intended for the Japanese market.
Some images or details may include Japanese text. Specifications are subject to change without notice.
Countries of sale:
Japan:反応過程近似解析ツール MiRuDa
Features
What is MiRuDa?
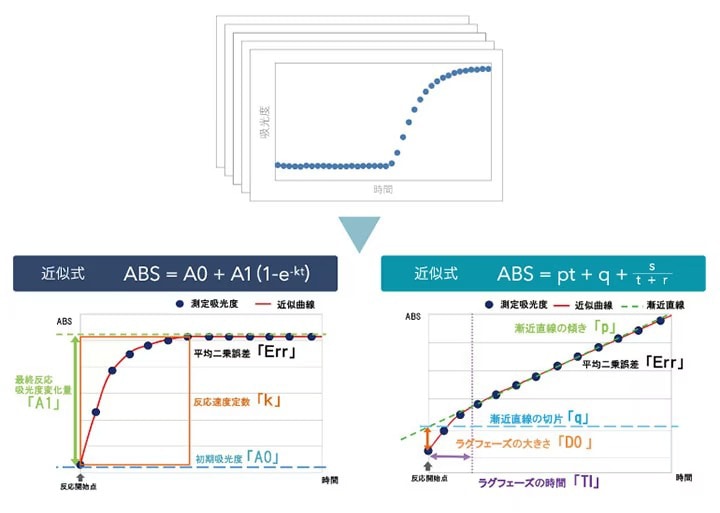
Reaction process data analysis method – reaction curve fitting
The reaction curve fitting method involves approximating individual reaction curve data using an approximation formula and analyzing the data based on the obtained parameters. These parameters are referred to as evaluation factors. Patterns in the reaction curve data are assessed using these evaluation factors.
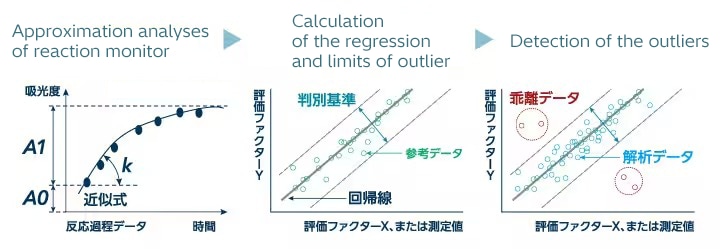
Identifying outliers
Reference data are collected, and a regression line is calculated based on the distribution of evaluation factors.
Reaction process data that fall outside the classification criteria derived from this reference data distribution are identified as outliers.
Example of use
Supporting confirmation of reaction curve data
You’re struggling to decide whether a retest is necessary.
You want to check the reaction curve data, but searching through the analyzer is tedious...
Isn't there a simpler way to check it?
▽
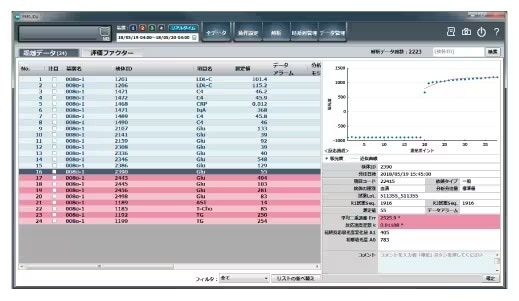
Only outliers are identified and displayed from the analyzed dataset. A list of data classified as outlier is shown on the specified instrument over the specified date range. Outliers can be filtered by “All,” “Data unread,” or “Data read” status. For each selected entry in the outlier list, a reaction curve graph and measurement details are displayed to support data confirmation.
* This tool does not detect all abnormalities in test data.
* Not all data classified as outliers are necessarily abnormal.
* The outlier detection rate may vary depending on the reference data and classification criteria settings.
* Confirmation of outliers must be performed by the user.
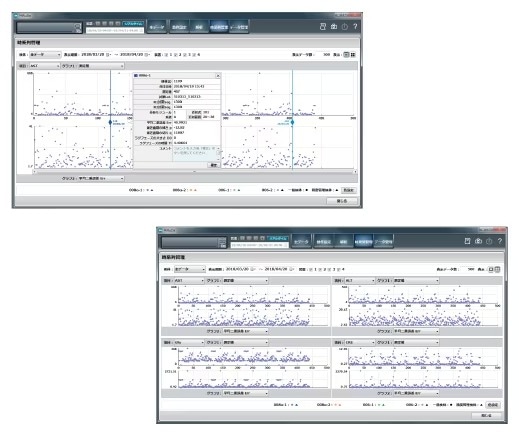
Displaying time-series changes in evaluation factors
The amount of data stored by the analyzer is limited.
Isn’t it possible to go back and check past data?
Long-term review is only possible for measured values of quality control samples,
and analysis requires the use of spreadsheet software.
▽
With this tool, you can display time-series data for evaluation factors and sample measurements over a specified period.
By simultaneously checking measurement values for the specified period and evaluation factors characterizing reaction curves, you can use this tool for instrument management.
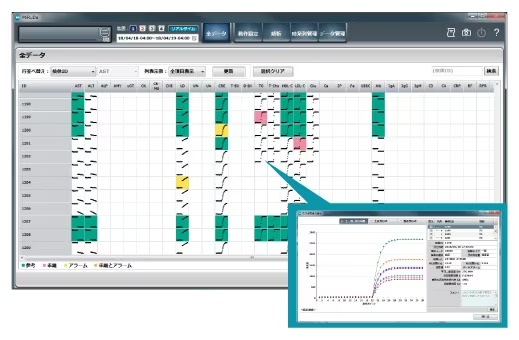
List view of data
During data analysis, you often face questions like: “Is the phenomenon limited to certain samples?”
“When did it start occurring?” “Are other tests showing changes?”
But checking everything at once is challenging.
▽
This tool allows you to display reaction curve images of the analyzed data and to review the reaction curve data in a list format.
You can easily review outliers (in red) and data with alarms (in yellow).
Selected data can also be overlaid.
By specifying conditions, you can sort the data by criteria such as dispensing time, measurement values, and analytical unit.
* This tool does not detect all abnormalities in test data.
* Not all data classified as outliers are necessarily abnormal.
* The outlier detection rate may vary depending on the reference data and classification criteria settings.
* Confirmation of outliers must be performed by the user.
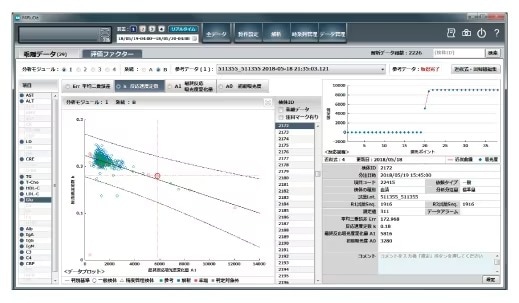
Reviewing the distribution of evaluation factors
You want a simple way to check data before and after instrument maintenance.
It’s hard to spot small changes in repeated measurements of quality control samples, and differences may go unnoticed even when comparing reaction curves side by side.
▽
This tool allows you to review the distribution of evaluation factors that characterize reaction process data.
By comparing these distributions before and after instrument maintenance or other operations, you can check whether any changes have occurred in the reaction curve data.
* This tool does not detect all abnormalities in test data.
* Not all data classified as outliers are necessarily abnormal.
* The outlier detection rate may vary depending on the reference data and classification criteria settings.
* Confirmation of outliers must be performed by the user.
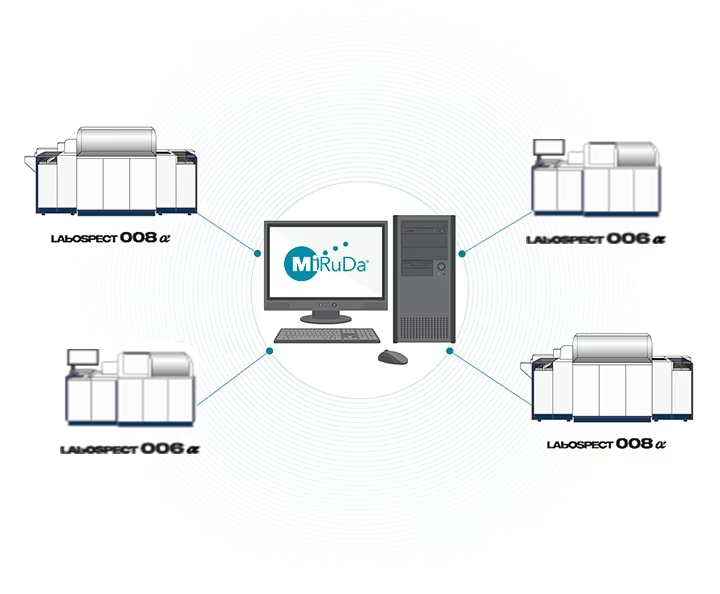
Configuration and specifications
System configuration
Up to four LABOSPECT 008 α, LABOSPECT 006 and 3500 units can be connected.
Specifications
| Item | Specifications |
|---|---|
| Method of analysis | Reaction curves fitting method |
| Data analysis | Selectable between real-time and batch processing |
| Number of analyzable tests | 200 tests per instrument (default setting: 33 tests) |
| Supported sample types | Routine samples, STAT samples, quality control samples |
| Supported analytical methods | Rate A, 2-point end, 1-point end |
| Data storage capacity | Approx. 7.5 million tests (on SVP hard disk) |
| External output | DVD-RAM, USB memory |
| Report output | PDF file format supported |
| Operating environment | Analysis PC | Service processor (SVP) |
|---|---|---|
| Power supply requirements | AC 100 V, 50/60 Hz, breaker capacity 10 A, three power sockets |
* This product is not a medical device.
* Screens are shown as examples and may be subject to change without notice.
This page contains product information intended for the Japanese market.