
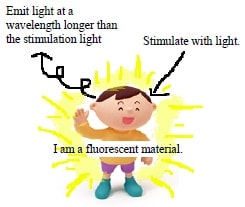
1. What is fluorescence?
1.1 When are you excited? (Excitation spectrum)
Please score your excitement in the following scenes.
1) Riding on a roller coaster.
2) Driving through a mountain pass.
3) Watching a soccer game in a stadium.
Persons A, B, and C answered these questions as follows.
| A | B | C | |
|---|---|---|---|
| Roller coaster | 70 | 90 | 30 |
| Driving a car | 80 | 30 | 40 |
| Watch a soccer game | 60 | 60 | 90 |
This shows the characters of A, B, and C well, doesn’t it?
More generally, a person is excited when stimulated. However, it can be said that different persons are more easily excited by different kinds of stimulation. A third person can observe another person's personality by observing his excitement when stimulated.
How can it be noticed that a person is excited? The answer is simple. Various phenomena, such as an elevated heart rate, sweating, appearing flushed, crying, and shouting appear when a person is excited. It is sufficient only to observe any one of them.
Now, let's change the subject to actual fluorophotometry.
Specimens handled by fluorophotometry are too excited by stimulation. Different specimens (materials) are excited by very different stimulation. Excited specimens exhibit various phenomena which prove that they are excited.
For example, they emit light. If they emit strongly, it means they are very excited, but if they emit weakly, it means that they are only little excited.
By the way, what is the source of stimulationfor a specimen? In the fluoroscopic method, light irradiation is used as a means to stimulate the specimen. Stimulation varies by changing the wavelength (color) of the irradiated light.
Based on the above, let's rewrite the opening questionnaire for fluorophotometry.
Please score the excitement (luminescence intensity) of each specimen in the following scenes.
1) Exposed to purple light.
2) Exposed to blue light.
3) Exposed to green light.
The answers (luminescence intensity) to these questions for Specimens A, B, and C were as follows.
| Light to expose | Specimen A | Specimen B | Specimen C |
|---|---|---|---|
| Purple | 70 | 90 | 30 |
| Blue | 80 | 30 | 40 |
| Green | 60 | 60 | 90 |
This shows characters of Specimens A, B, and C well, doesn't it?
In general, specimens handled by fluorophotometry will be excited to emit light when they are exposed to light. However, it can be said that different specimens are more likely to be excited (to emit) by light of different wavelengths. We can see the character of a certain specimen by observing its emission when irradiated with light of various wavelengths.
By the way,
State where the specimen is excited:.........Excited state
Light used for excitation:..........................Excitation light
Emission after excitation:..........................Fluorescence
Answers to the questionnaire:...................Excitation spectrum
With our eyes, we can distinguish excitation light only by using the names of colors such as purple, blue, and green. In fluorophotometry and spectral analysis, these colors of light are distinguished by wavelength(unit: nm, nanometer, 1 nm = 1 / billion m). Although it greatly depends on an observer's eyes, it is said that it is sufficient to observe only one phenomenon to confirm the excitement mentioned in the previous section.
Purple: 400 - 420 nm
Blue: 450 - 500 nm
Green: 500 - 550 nm
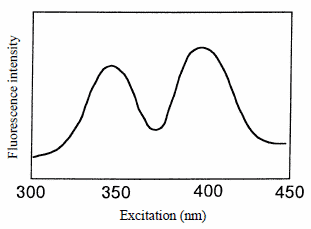
The shape of a general excitation spectrum is as follows. The illustrated specimen emits fluorescence most strongly when excited (stimulated) by light at 400 nm (thus, being excited to emit light) and also emits fluorescence considerably, although less when excited with an excitation light of 350 nm. A more detailed measurement example is provided in the Appendix.
1.2 What happens after excitement? (Fluorescence spectrum)
In the previous section, we explained that it is sufficient only to observe one phenomenon to confirm that a person is excited. However, let’s talk about the key to determine the character of a specimen in more detail.
Please answer questionnaire, once again.
Please score the following items, assuming that you are excited.
1) Sweating
2) Flushed
3) Have a racing pulse
A, B and C answered to the questions as follows.
| Light to expose | Specimen A | Specimen B | Specimen C |
|---|---|---|---|
| Purple | 70 | 90 | 30 |
| Blue | 80 | 30 | 40 |
| Green | 60 | 60 | 90 |
The results show the characteristics of A, B, and C respectively.
Information about what happens after excitement expresses their characteristics (for example, C is a great sweater). A third person observes what happens to the excited person as a clue for knowing his personality.
As mentioned before, the emission after excitement is measured in fluorophotometry. Fluorescent emission can be distinguished by its color (wavelength), just as a person can be distinguished by his/her physical response. The above questionnaire is rewritten for fluorophotometry, as follows.
Please score how the excited specimen emits light (fluorescent light) of the following colors.
1) Emits yellow fluorescence.
2) Emits orange fluorescence.
3) Emits red fluorescence.
The answers to these questions for Specimens A, B, and C were as follows.
| Specimen A | Specimen B | Specimen C | |
|---|---|---|---|
| (1) Yellow | 30 | 40 | 80 |
| (2) Orange | 60 | 80 | 40 |
| (3) Red | 90 | 60 | 50 |
These results represent the characteristics of Specimens A, B and C, well.
The information about the color (wavelength) of the fluorescent light emitted by the excited specimen expresses the characteristics of the specimen, as well. A third person observes the wavelength of the fluorescent light emitted by the excited specimen as a clue for knowing the characteristics of the specimen.
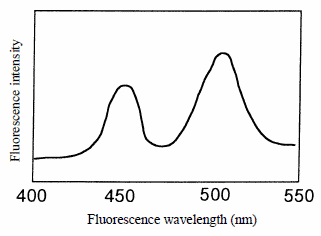
The result of the above questionnaire is called a fluorescence spectrum. The figure on the right shows the shape of a general fluorescence spectrum. When the specimen is excited, it emits fluorescent light with wavelength of 500 nm most strongly, and 450 nm fluorescent light less, but considerably. A more detailed measurement example is presented in the Appendix.
1.3 What if there are many human clones? (Quantitative measurement)
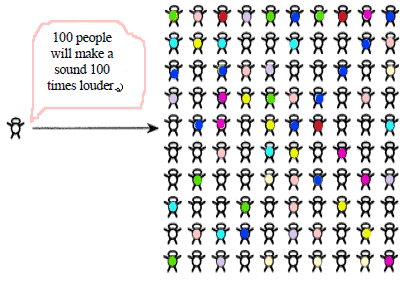
The next scenario is from science fiction. Suppose that it were possible to make many human clones (duplicated humans). Let's say that 100 clones were made of a person who would shout unconsciously when excited. What happens if the clones are gathered in one room and stimulated to be excited?
If they are perfect clones, a scream 100 times louder than that of one person will resound all over the room.
If the loudness of one person's shout is measured beforehand, and the stimulation is provided in a room where an unknown number of clones are present, the number of clones in the room can be figured out by measuring the total loudness of the shout.
The quantitative operation which measures the concentration of a specimen by the fluoroscopic method is very similar to this.
If there are several specimens with the same components in which only the concentration varies, the fluorescence intensity becomes small (for a shout, a small sound volume) if the specimens are dilute (in the case of human clones, there are only a few), and the fluorescence intensity becomes large (a larger sound volume) if the specimens are dense (if there is a large number).
| Concentration of standard sample (ppm) | Fluorescence intensity |
|---|---|
| 00 05 10 15 20 25 |
05.0 15.0 25.0 35.0 45.0 55.0 |
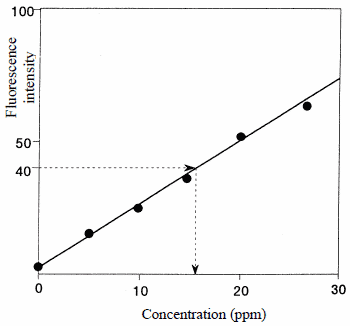
A set of specimens (standard sample) with known concentrations are prepared to measure their fluorescence intensity. The results are plotted to obtain a calibration curve. After a calibration curve has been obtained, a specimen with unknown concentration can be measured.
For example, suppose the fluorescence intensity of the specimen is 40. By consulting the calibration curve shown in the right-hand figure, the concentration of the specimen can be estimated at 16 ppm.
What concentration range can actually be measured?
Based on the theory described above, it would seem that it is possible to measure even the most concentrated specimens, but that’s not true. If a specimen is too dense, the fluorescence emitted from a certain part of the sample cell may be absorbed by its surroundings (which may distort the shape of the excitation/fluorescence spectrum), or the excitation light may not reach sufficiently deep into the sample cell, leading to decrease in fluorescence. Of course, if it is too dilute, fluorescence will be too weak to detect. In both cases, the measurable concentration range greatly depends on a measured object.
1.4 What's the difference from absorptiometry?
1.4.1 Wavelength to measure
In both absorptiometry, using an ultraviolet-visible spectrophotometer and fluorometry using a spectrofluorophotometer, measurement is carried out by irradiating light of various wavelengths onto the specimen. In this sense, they are very similar in terms of the configurations of the hardware of the systems. They are also similar in that the horizontal axis of plotted spectra is wavelength.
However, there is a definite difference between the measurement methods.
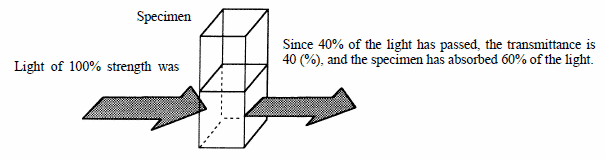
Absorptiometry measures how much of the irradiated light is absorbed by the specimen. Since the light, except for the absorbed portion passes through the specimen, the quantity of absorbed light can be estimated by measuring the intensity of the passed light (measurement of transmittance and reflectivity).
Please note that decreases in the irradiated light are observed while the wavelengths of the irradiated light and observed light are the same.
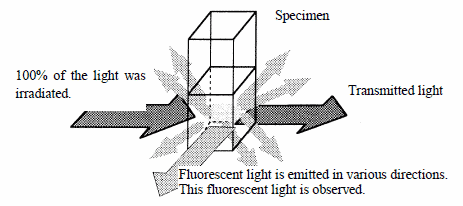
On the other hand, in observing emission in fluorometry, the irradiated light and the observed light are different; that is, they have different wavelengths.
Now let's consider this in more detail.
There are the following relations between wavelength of light and the energy that one photon of the light has.

In fluorescence, the energy of the excitation light is absorbed, and then the energy is transformed into a different form of light energy (fluorescent light), which is then emitted. However, some energy can be lost in the conversion process. All the energy of the absorbed excitation light cannot be converted into fluorescence. Since there is some loss, the fluorescence energy will be smaller than the absorbed energy.
Therefore, the wavelength of the fluorescent light is always greater than the wavelength of the exciting light (Stokes's law).
In the figure, the fluorescent light is detected at a right angle to the excitation light. In particular, if it were detected in the direction the irradiated light passes, as in absorptiometry, the irradiated excitation light would be detected, as well.
As mentioned before, since the fluorescent light, but not the excitation light, is detected in the fluoroscopic method, it is not desirable that the excitation light enters the detection system.
So, the fluorescent light is detected in a perpendicular direction (at a right angle), at which the excitation light may enter the detection system the least. It can be observed at a right angle, since fluorescent light is usually emitted isotropically (in all directions).
Nevertheless, some of the excitation light enters the fluorescent light detection system, because of various irregular reflection events.
1.4.2 High sensitivity
In comparing quantitative measurements by the absorptiometry and the fluoroscopic methods, a specimen as dilute as 1/1000 of that measurable by absoptiometry can generally be measured by the fluoroscopic method. It is said that the detection limit of the fluoroscopic method is lower by three orders of magnitude.
Why is this?
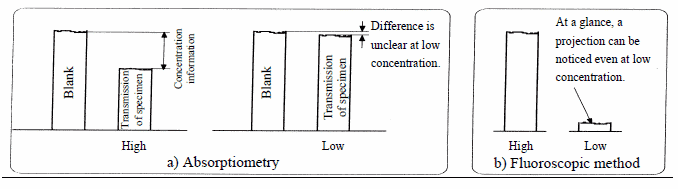
From a glance at the following figure, it seems that the difference in the bar chart heights of the transmission of the blank and the specimen (information on concentration) at low-concentration by absorptiometry is clearer. However, the difference can easily be noticed at low concentrations in the fluoroscopic method, even when low bar charts are compared, when no light is emitted.
The fluoroscopic method is advantageous at low-concentrations.
It is as follows in theory.
Let's consider a dilute specimen with a transmittance of 99%. Although any measurement is accompanied by an error, we assume it to be 0.1% in this case. In normal absorptiometry, the quantity of transmitted light is measured compared with a blank (concentration of 0). Since error factors affect both the blank and the specimen by the same ratio,
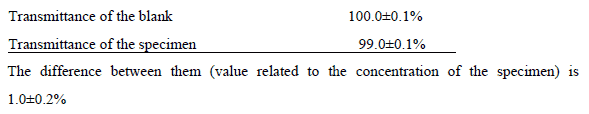
Since the error in the concentration measurement is 0.2%, while the difference of transmittance is 1.0%, it will include an error of 20%. On the other hand, since the difference with the zero level often corresponds to the concentration of the specimen in the fluoroscopic method,
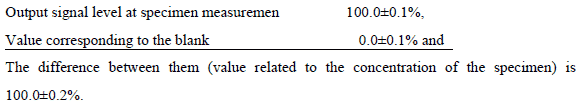
The fluoroscopic method is very advantageous at lower concentrations, since the percentage error does not depend on the concentration of the specimen. In absorptiometry, the point where the concentration information (difference between the transmissions of the blank and the specimen), indicated by the arrow head in the figure becomes comparable to the noise level is the detection limit (0.2% here).
Since the amount of fluorescence itself is the concentration information (not the difference, as in absorptiometry) in the fluoroscopic method, if the fluorescent light is emitted it is possible to detect it by amplifying an electric signal.
Comparison of the detection limits of the spectrophotometer and spectrofluorophotometer systems (concentration units: μg/mL)
| Materials | Spectrophotometer Absorbancy 0.001 |
Spectrofluorophotometer Detection limit |
|---|---|---|
| Benzene | 1×10⁻³ | 1×10⁻³ |
| Anthracene | 2×10⁻³ | 5×10⁻⁴ |
| Quinine sulfate | 2.3×10⁻³ | 1×10⁻⁵ |
| Riboflavin | 1.9×10⁻² | 1×10⁻⁵ |
| Rhodamine B | 8.2×10⁻³ | 1×10⁻⁶ |
| Chlorophyll | 5×10⁻¹ | 5×10⁻³ |
Note: Spectrofluorophotometer model 650-10S was used. The detection limit was defined at a point where the fluorescent signal becomes twice as high as the background.
1.4.3 Large amount of information.
In the fluoroscopic method, there are two kinds of wavelengths: an excitation wavelength and a fluorescence wavelength. In a spectrum measurement, there are thus two kinds of spectra: an excitation spectrum and a fluorescence spectrum. In absorptiometry, there is only an absorption spectrum. The fluoroscopic method provides more information on the same specimen than the absorptiometry. By the way, an excitation spectrum is used to determine the most effective excitation wavelength to induce fluorescence.
The energy of the excitation light has to be absorbed to induce fluorescence. It is natural to expect that if more is absorbed, more fluorescence will be generated. That is, an excitation spectrum turns out to be a spectrum very similar to the absorption spectrum of absorptiometry.
1.4.4 Shoot at one component
Assume that two components A and B were mixed in a sample cell. If their absorption wavelengths were almost the same .....
In absorptiometry, they cannot be distinguished. However, in the fluoroscopic method, if the fluorescence wavelengths are different, even though the absorption wavelengths are the same, several components can easily be distinguished (although the excitation spectrum of each component is almost the same). One component out of many can be selectively measured.
1.4.5 Weak point of the fluoroscopic method
So far, the fluoroscopic method has been described as if it is very excellent compared with absorptiometry.
However, the fluoroscopic method has some weak points, as well.
- Most natural materials emit fluorescence very scarcely, even when exposed to excitation light of various wavelengths. Components which can be measured are thus limited, compared with absorptiometry. When working with a material which does not emit fluorescence, it may become measurable after pretreatment. However, the pretreatment is often complicated.
-
The results of measurement in absorptiometry are universal. Any system of any manufacturer may provide the same value, in principle.
However, in the fluoroscopic method, the fluorescence intensity is a relative intensity, which has no units. For example, even systems of the same model of the same manufacturer may often provide different results due to individual differences in the detectors, etc. Even if the same specimen is measured, the luminescence intensity varies, say by 100 or 50 (although the shape of the spectrum does not change). Needless to say, the same will be true with other manufacturers' systems.