
2. Mechanism of the Spectrofluorophotometer
2.1 General mechanism
The block diagram below shows a general spectrofluorophotometer.
(1) The excitation source is a light source for providing excitation light to irradiate a specimen, and a xenon lamp is usually used.
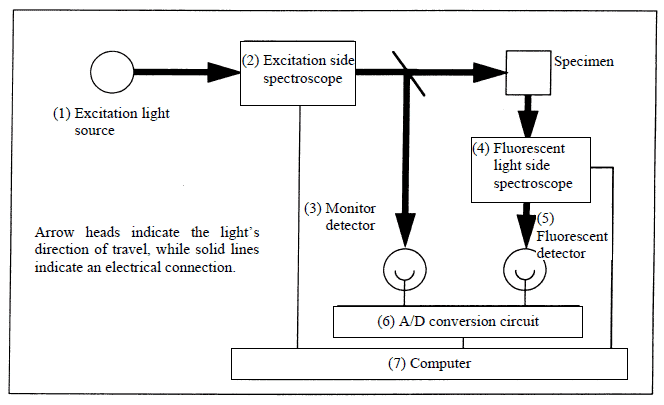
White light (light composed of various wavelengths) emitted from the light source enters an excitation side spectroscope (2). While measuring an excitation spectrum, this excitation side spectroscope (2) is moved to successively change the wavelength used to irradiate the specimen (this is called scanning or wavelength scanning). In contrast, when measuring a fluorescence spectrum, a specific wavelength is selected and fixed in the excitation side spectroscope.
The light emitted from the excitation side spectroscope travels towards the specimen to excite it. Along the way, a half-mirror is used to split the light beam (diagonal line in the figure above) so that a portion also travels to the monitor detector (3). The monitor detector monitors the intensity of the excitation light irradiating the specimen. Generally, a photoelectric tube (phototube), a photodiode, a photomultiplier tube (also called a photomultiplier or photomul), etc are used.
When the excitation light reaches the specimen, the specimen is excited to emit fluorescent light. The emitted fluorescent light enters a fluorescent light side spectroscope (4) (although omitted in the diagram, this light is condensed by a lens).
When measuring the excitation spectrum, a specific wavelength is selected and fixed in the fluorescent light side spectroscope (4). When measuring a fluorescence spectrum, the fluorescent light side spectroscope is moved to measure the wavelengths of the emitted fluorescent light.
The fluorescent light leaving the fluorescent light side spectroscope enters the fluorescence detector (5). Generally, a photomultiplier tube is used. A fluorescent light detector converts the fluorescent light into an analog electric signal which is converted into a digital signal by an A/D conversion circuit (6).
A computer (7) controls wavelength scanning and digital signal processing.
2.2 Components to be used
The following is an optical system diagram of a spectrofluorophotometer.
Although detailed descriptions are omitted here, it is constituted of many optical devices like this.
2.3 Precautions in comparing performance
Performance specifications of a system are described in the last page of its catalog. Meanings of terms used here and how to read numbers are explained.
- Sensitivity: An item a user cares the most. This is an index indicating how smooth data with little noise is obtained, and it can be said that the larger the index the better the system is. It is also called S/N (signal/noise). However, the number varies a lot with a measurement condition of sensitivity. It is not meaningful to compare without confirming that conditions such as a slit (bandpass) and a response (time constant) are the same. Some manufacturers report sensitivity measured on advantageous conditions in catalogs.
- Light source: Manufacturers with some exceptions adopt 150 W xenon lamps for excitation sources. With an ozoneless lamp which offers very weak light of wavelength less than 220 nm, it is impossible to use light less than 220 nm as excitation light.
- Measurement wavelength range: the wider the more versatile.
-
Slit: Also called bandpass. It represents the width of the slit at the inlet/outlet of a spectroscope. If the slit width is large, data with relatively lower noise (sensitive) can be obtained since the amount of light increases, however, minute peaks of a spectrum cannot be determined. If it is narrow, the minute peaks of the spectrum can be determined, however, light decreases leading to noisy data.
Although it is greatly dependent on a specimen, since priority is given to that there is little noise when using a spectrofluorophotometer for quantifying a dilute specimen etc., it is not necessary to adhere to narrow slit width.
- Response: If a large response is chosen, a spectrum becomes smooth, however, the shape will become blunt. When measuring excitation/fluorescence spectrum, optimal response should be selected depending on the scanning speed. Even if response is small (fast), noise will increase or a spectrum will be distorted if the response suitable for scanning speed is not chosen.
- Others: Special measurement such as three-dimensional measurement and phosphorescence measurement may be possible using an optional software, some models can manage in standard.