3. Advanced Measurements
3.1 Spectrum correction
As described in "Differences from Absorptiometry" and "Weak point of fluoroscopic method", the output data and shape is expected to vary with the system. If the same system model is used, the shape of the spectrum will remain the same, while only the data will differ between experiments. However, if different system models are used, even the shapes of the obtained spectra may differ. This is due to the specific characteristics of the optical system of each model. In a spectrum correction, the system characteristics (instrumental function) are measured in advance, and then used to process the output data for balance.
Some Hitachi spectrofluorophotometers have a function which measures the instrumental function using a standard. In this case, in the excitation side correction, the standard is rhodamine B. In the fluorescent light side short wavelength, it is a diffusion component. An optional substandard light source is used for fluorescent light side long wavelengths.
3.2 Three-dimensional measurement
An excitation spectrum is obtained by scanning the excitation wavelength, and a fluorescence spectrum is obtained by scanning the fluorescence wavelength. The lower left figure shows many spectra obtained by repeatedly measuring fluorescence spectra while changing the excitation wavelength. The lower right figure is a contour representation of the lower left figure. Such a three dimensional spectrum carries all of the information of tens of fluorescence spectra and excitation spectra, conveniently expressing a large amount information.
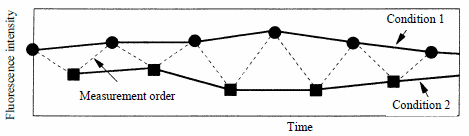
3.3 Intracellular calcium ion concentration measurement
The intracellular calcium ion concentration can be measured using the fluoroscopic method. The time variation of the output is measured while successively applying several wavelength conditions, allowing the concentration to be calculated.
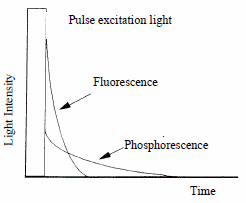
3.4 Phosphorescence measurement
In a normal spectrofluorophotometer, a specimen is continuously irradiated with excitation light. If irradiated with a pulse (i.e., a flash of light), the fluorescence will disappear within the order of tens of nanoseconds (1 ns = 10-9 s), leaving phosphorescence, which continues to gleam for several milliseconds to several seconds. In some models, a continuous excitation may convert into a light pulse with a chopper, to allow measurement of the phosphorescence component of the sample’s response.