
Appendix
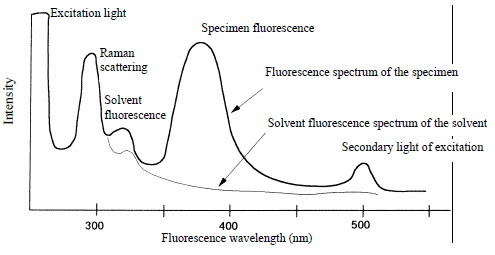
Measurement example for a fluorescence spectrum
In a measurement, various components, including Raman scattered light, the fluorescent light of both the solvent and specimen, and secondary light of excitation are mixed with the excitation light.
Glossary
| 1) | Sensitivity | Used to indicate system performance. Generally, this quantity is expressed by a signal to noise ration. |
|---|---|---|
| 2) | Xenon lamp | Light source used for excitation |
| 3) | Fluorescent light | Light emitted by the excited specimen. |
| 4) | Unit of fluorescence intensity | Relative intensity; no units |
| 5) | Fluorescent detector | Detector for measuring the intensity of emission. A photomultiplier tube (photomul) is commonly used. |
| 6) | Fluorescence spectrum | Spectrum obtained by measuring the fluorescence wavelength |
| 7) | Detection limit | Concentration of the most dilute specimen which can be measured. This limit depends on the specimen. |
| 8) | Calibration curve | Graph for converting fluorescence intensity into concentration. |
| 9) | Photomultiplier tube | → fluorescence detector |
| 10) | Measurement of intracellular Ca2+ concentration | One example of the application of the fluoroscopic method. The time changes at two or more wavelengths are measured simultaneously. |
| 11) | Three-dimensional measurement | A fluorometry technique using three axes: excitation wavelength, fluorescence wavelength, and fluorescence intensity. The output data contains much information. |
| 12) | Scanning | The successive shifting of the wavelength of a spectroscope to obtain a spectrum, or the resulting measurement. |
| 13) | Stokes’ Law | The principle that the fluorescence wavelength is longer than the excitation wavelength. |
| 14) | Spectrum correction | Measurement with processing to compensate for the characteristics of the specific system used. |
| 15) | Slit | The slit at the entrance of the spectroscope. This determines the resolution of the spectrum. |
| 16) | Instrumental function | The characteristics of the specific system |
| 17) | Secondary light | Light which appears at a wavelength twice that of the light entering spectroscope. For example, if light at a wavelength of 300 nm enters the spectroscope, secondary light will appear at 600 nm. 12 |
| 18) | White light | Light with various wavelength components (sunlight or light of a xenon lamp). |
| 19) | Wavelength | Number corresponding to the color (energy) of light; commonly expressed in nm (nanometer) nm. |
| 20) | Wavelength scanning | → Scanning |
| 21) | Bandpass | → Resolution |
| 22) | Resolution | Indicatedsthe most narrow peak that can be measured. |
| 23) | Raman scattering | A type of scattered light which appears when materials are irradiated. |
| 24) | Phosphorescence | A type of emission. Even if the excitation light is cut off, the light due to phosphorescence will gleam longer than the fluorescent light. |
| 25) | Excitation source | → Xenon lamp |
| 26) | Excited state | State in which a specimen has absorbed energy. |
| 27) | Excitation | spectrum Spectrum obtained by scanning the wavelength of the excitation light. This spectrum resembles an absorption spectrum. |
| 28) | Response | Index which weakens the output data. A number suitable for the scanning speed must be chose. |
| 29) | Excitation light | Light used to excite a specimen. |