
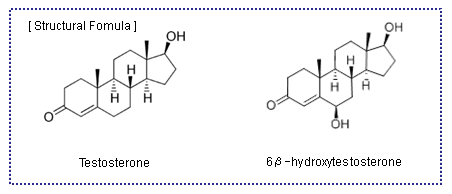
Simultaneous Analysis of Testosterone and Metabolites
After being ingested, drugs normally undergo metabolism by cytochrome P450(CYP) in the liver.
CYP is an enzyme that converts foreign substances introduced in vivo into forms that are easily excreted in vitro.
Many molecular species of CYP have been identified, but among these, 9 species, CYP1A2, 2A6, 2B6, 2C8, 2C9, 2C19, 2D6, 2E1, and 3A4, are primarily involved in drug metabolism. In particular, CYP3A4 metabolizes the majority of commercial medicines.
In this study, analysis examples of testosterone, an indicator substrate of CYP3A4, and 6β-hydroxytestosterone, a metabolite produced from testosterone, will be introduced.
* This reaction is a metabolic reaction indicator for the activity evaluation of HLM (human liver microsomes) in the evaluation of drug metabolism.
Simultaneous Analysis of Testosterone and Metabolites
Sample
Testosterone(reaction solution of human liver microsomes)
Metabolites (6β-hydroxytestosterone and 6β-OH TES) produced from the reaction of testosterone, a type of steroid hormone, and commercial human liver microsomes (HLM).
Pretreatment of Sample
0.2 mg/mL Human liver microsomes
10 mM Kpi (pH 7.4)
200 µM Testosterone
NADPH generating system
Total 200 µL
Incubate at 37°C for 30 min
![]()
Stop reaction with 2 mL of CH2Cl2
![]()
Add 1 mL of 3 M NaCl
![]()
Add 20 µL of 20 µM Corticosterone as internal standard
![]()
Vortex vigorously
![]()
Centrifuge at 2,000 rpm for 5 min
![]()
Collect organic layer
![]()
Dry under N2 stream
![]()
Reconstitute with 200 µL of mobile phase
![]()
Inject 10 µL to HPLC
Conditions
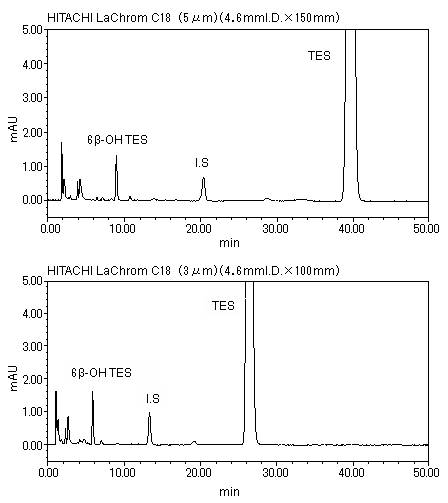
| Column | HITACHI LaChrom C18 (5 µm) (4.6 mmI.D. x 150 mm) HITACHI LaChrom C18 (3 µm) (4.6 mmI.D. x 100 mm) |
|---|---|
| Mobile phase | 50% CH3OH/10 mM potassium phosphate buffer (pH 7.4) |
| Flow rate | 1.0 mL/min |
| Column Temperature | 35°C |
| Detection | UV 240 nm |
| Injection vol. | 10 µL |
System configuration
5110 Pump
5210 AutoSampler
5310 Column Oven
5420 UV-VIS Detector
Empower2 Data Processing System
Analysis Result
* Results using two columns which differ in size
* This analysis sample was provided by Miki Nakajima, Associate Professor of College of Medical, Pharmaceutical,and Health Science School of Pharmacy at Kanazawa University.
NOTE:
These data are an example of measurement; the individual values cannot be guaranteed.
The system is for research use only, and is not intended for any animal or human therapeutic or diagnostic use.
In order to read a PDF file, you need to have Adobe® Reader®