
Highly Sensitive Analysis of Organic Acids
Organic acids are known as ingredients that determine the taste and flavor of foods. In addition to the food sector, many other areas such as pharmaceutical and chemical industries, environmental analysis, and biotechnology, analyze organic acids.
Analysis methods of organic acids include UV detection (detection of absorption of carboxyl groups), electrical conductivity detection (detection of ionic compounds), a method using pH indicators (visible absorption detection of pH changes caused by acidic components) and a post-column derivatization method for high selectivity of detection.
An appropriate method must be selected based on analysis samples and purposes.
The following describes examples of analysis of organic acids using a portable UV detection system and the reversed-phase column,"LaChrom C18-AQ"*1.
Analysis of Organic Acids
Samples
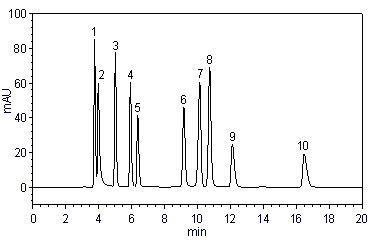
Organic acid standard samples
| Concentration of Samples | mg/L | |
|---|---|---|
| 1 | Tartaric acid | 500 |
| 2 | Tartaric acid | 1,000 |
| 3 | Malic acid | 1,000 |
| 4 | Lactic acid | 1,000 |
| 5 | Acetic acid | 1,000 |
| 6 | Pyroglutamic acid | 100 |
| 7 | Citric acid | 1,000 |
| 8 | Fumaric acid | 10 |
| 9 | Succinic acid | 1,000 |
| 10 | Propionic acid | 1,000 |
*1"LaChrom C18-AQ" column
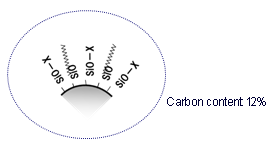
Low-carbon ODS columns:
By reducing the hydrophobicity of the silica surface, stable analysis even in a 100% aqueous solution can be conducted with the ODS columns.
The columns are especially suitable for the separation of compounds with high polarity, such as sugars, nucleic acids, and organic acids.
Conditions
| Column | HITACHI LaChrom C18-AQ (5 µm) (4.6 mmI.D. x 250 mm) |
|---|---|
| Elute | 1mmol/L H2SO4+ 8 mmol/L Na2SO4(pH 2.8) |
| Flow rate | 1.0 mL/min |
| Column Temperature | 25°C |
| Detection | UV 210 nm |
| Injection vol. | 10 µL |
System configuration
5110 Pump
5210 AutoSampler
5310 Column Oven
5420 UV-VIS Detector
Empower2 Data Processing System
Analysis result of standard samples:
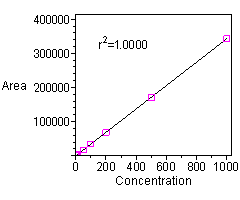
Linearity
Fairly linear standard curves have been obtained with the following concentration ranges:
Formic acid, malic acid, lactic acid, citric acid, succinic acid, propionic acid: 5 - 1000mg/L, tartaric acid : 2.5 - 500 mg/L, pyroglutamic acid:0.5 - 100 mg/L, fumaric acid:0.05 - 10 mg/L
Standard Curve
Analysis example of standard samples:
commercial grain vinegar and apple cider vinegar
[Pretreatment method of the samples]
Analyzed after dilution 50 times with pure water and filtered through 0.45 µm filters.
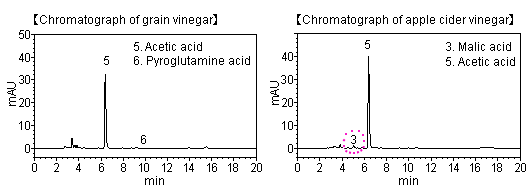
Results
Acetic acid, the main ingredient of the sourness of vinegar, is detected both in grain vinegar and apple cider vinegar. Also malic acid, mainly contained in fruit, is detected in
apple cider vinegar.
Comparison of separation patterns at different column temperatures
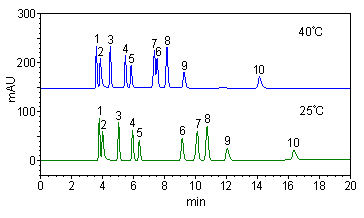
Elution behavior of organic acids at specific analysis temperature significantly depends on their ingredients. The elution order may be reversed, like pyroglutamic acid and citric
acid, so attention must be paid.
NOTE:
These data are an example of measurement; the individual values cannot be guaranteed.
The system is for research use only, and is not intended for any animal or human therapeutic or diagnostic use.
In order to read a PDF file, you need to have Adobe® Reader®